

Introduction
On July 17 the Dow closed at 52,146.42, back under the 52,500 line I set in DJIA - The First Checkpoint (#309). In last week’s P.S. I said I’d write the moment that happened, so here I am.
It was ticked first on July 13 at 52,498.64, then reclaimed for three sessions. The 17th took it out by 353.58. I read the 13th as a tick and the 17th as the break.
In Squaring the Cube into Early August (#315) I moved off the ripple read from The dip that may only be a ripple (#314) and called early August a possible crest, and this break is the first thing that argues for it. So, is the high already behind us? My answer is probably not yet, and answering it meant going back over what I’ve written this year. The Fibonacci squares, the midterm set and the 60-year cycle each read differently now than when I posted them, and between them they’re most of my answer.
Where the count lands
I flagged the Fibonacci rhythm in The dip that may only be a ripple (#314), set out the squares in my post #315, and put the musical-scale version in a substack note on July 14. All three read differently now. The Dow tagged 20,736 twice in nine sessions: as a high on March 24, 2020 at 20,737.70, and again as a low on April 2 at 20,735.02, within 1 point. It crossed the level, then came back to test it from above.
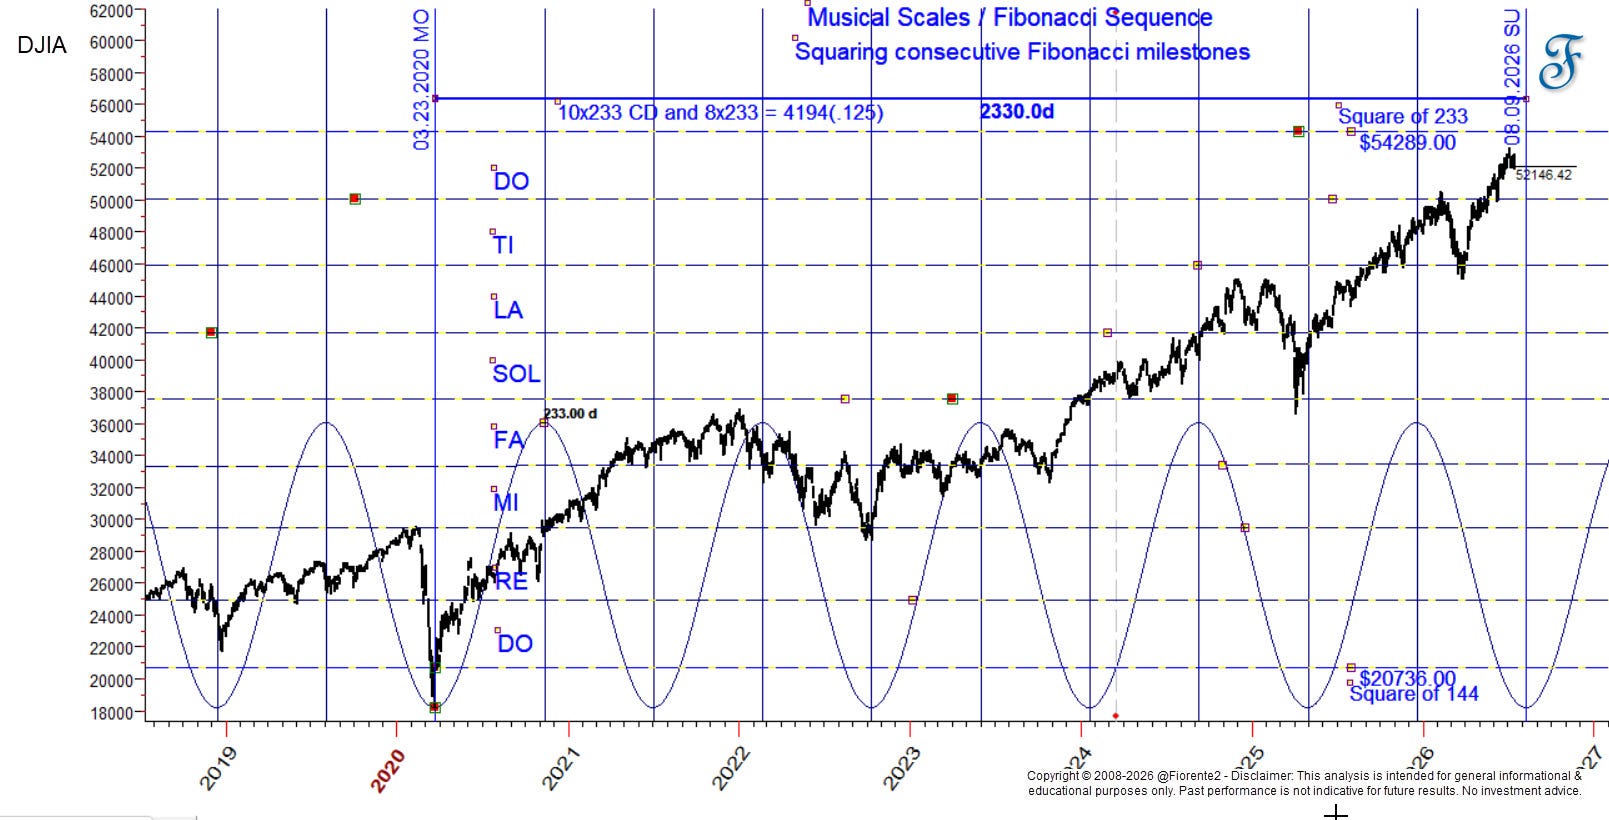
So I don’t need to adjust anything. The square of 233 stays at 54,289, and the time node stays August 9, 2026, which is 2,330 days from that low, or 10 times 233.
The note showed why I keep calling it a scale. The run from 20,736 to 54,289 is 33,553 points, and it divides into 8 even steps of 4,194.125, the way an octave divides. The seventh step sits at 50,094.88. The eighth is the square of 233 itself. We closed July 17 at 52,146.42, roughly halfway between the two, still a step short of the octave.
So we’re arriving in time, and we haven’t arrived in price. If the same structure repeats up there, I’d expect 54,289 to be tagged and retested rather than touched once, which leaves room for a double top. Either way I read that last step as latitude for a high still to be set, not a target already missed.
The second-year position
2026 sits in the second year of the 4-year presidential cycle. I built that set in Politicians Are Like Tigers, where the top three came out 1966, 1926 and 1898 and my bias was 1966. The ranking has moved since, and I’ve re-measured all 35 years back to 1886.
Across the whole set 15 of 35 topped by July 31, about 43%. That’s near a coin toss, so I use the conditional number instead. 2026 came into July up 7.78%. Eleven of the 35 were up more than 5% at the same point, and 10 of those 11 went on to a further high later in the year. Only 1890 did not, and it finished 19.4% below its mid-July level.
So a market arriving in July the way this one did usually gets one more high. That’s the main reason I don’t think the top is in.
The 60-year line, inverted for now
I’m not dropping the 1966 comparison. Over the January to July window it correlates with 2026 at a Pearson r of -0.41, rank 24 of 35, and that number is the point rather than a reason to walk away.
The 60-year line called a February high, which 2026 delivered on schedule, then an autumn low. Instead the index kept rising. So the clock tracked and the direction inverted, which isn’t the same as the cycle failing.
A cycle can invert for half a year and then resume. I set out that inversion scenario in My Banker Called Me Nuts, and in The Annual Forecast Dilemma I answered a reader on exactly this, that inversions have so far resolved back to the path. Sooner in some cases, later in others. If it resolves here, the second half falls in line with the 60-year path, which my latest cycle run has down near 20% on the year by September, and that sits with the year-6 zone.
What the analog set says
Re-measured through July 17, 1898 firmed from r 0.809 to r 0.832 and holds rank 1. It went up while the level broke, which isn’t what I expected. 1890 sits at r 0.683, rank 3, and 1978 at r 0.652 has slipped to rank 5.
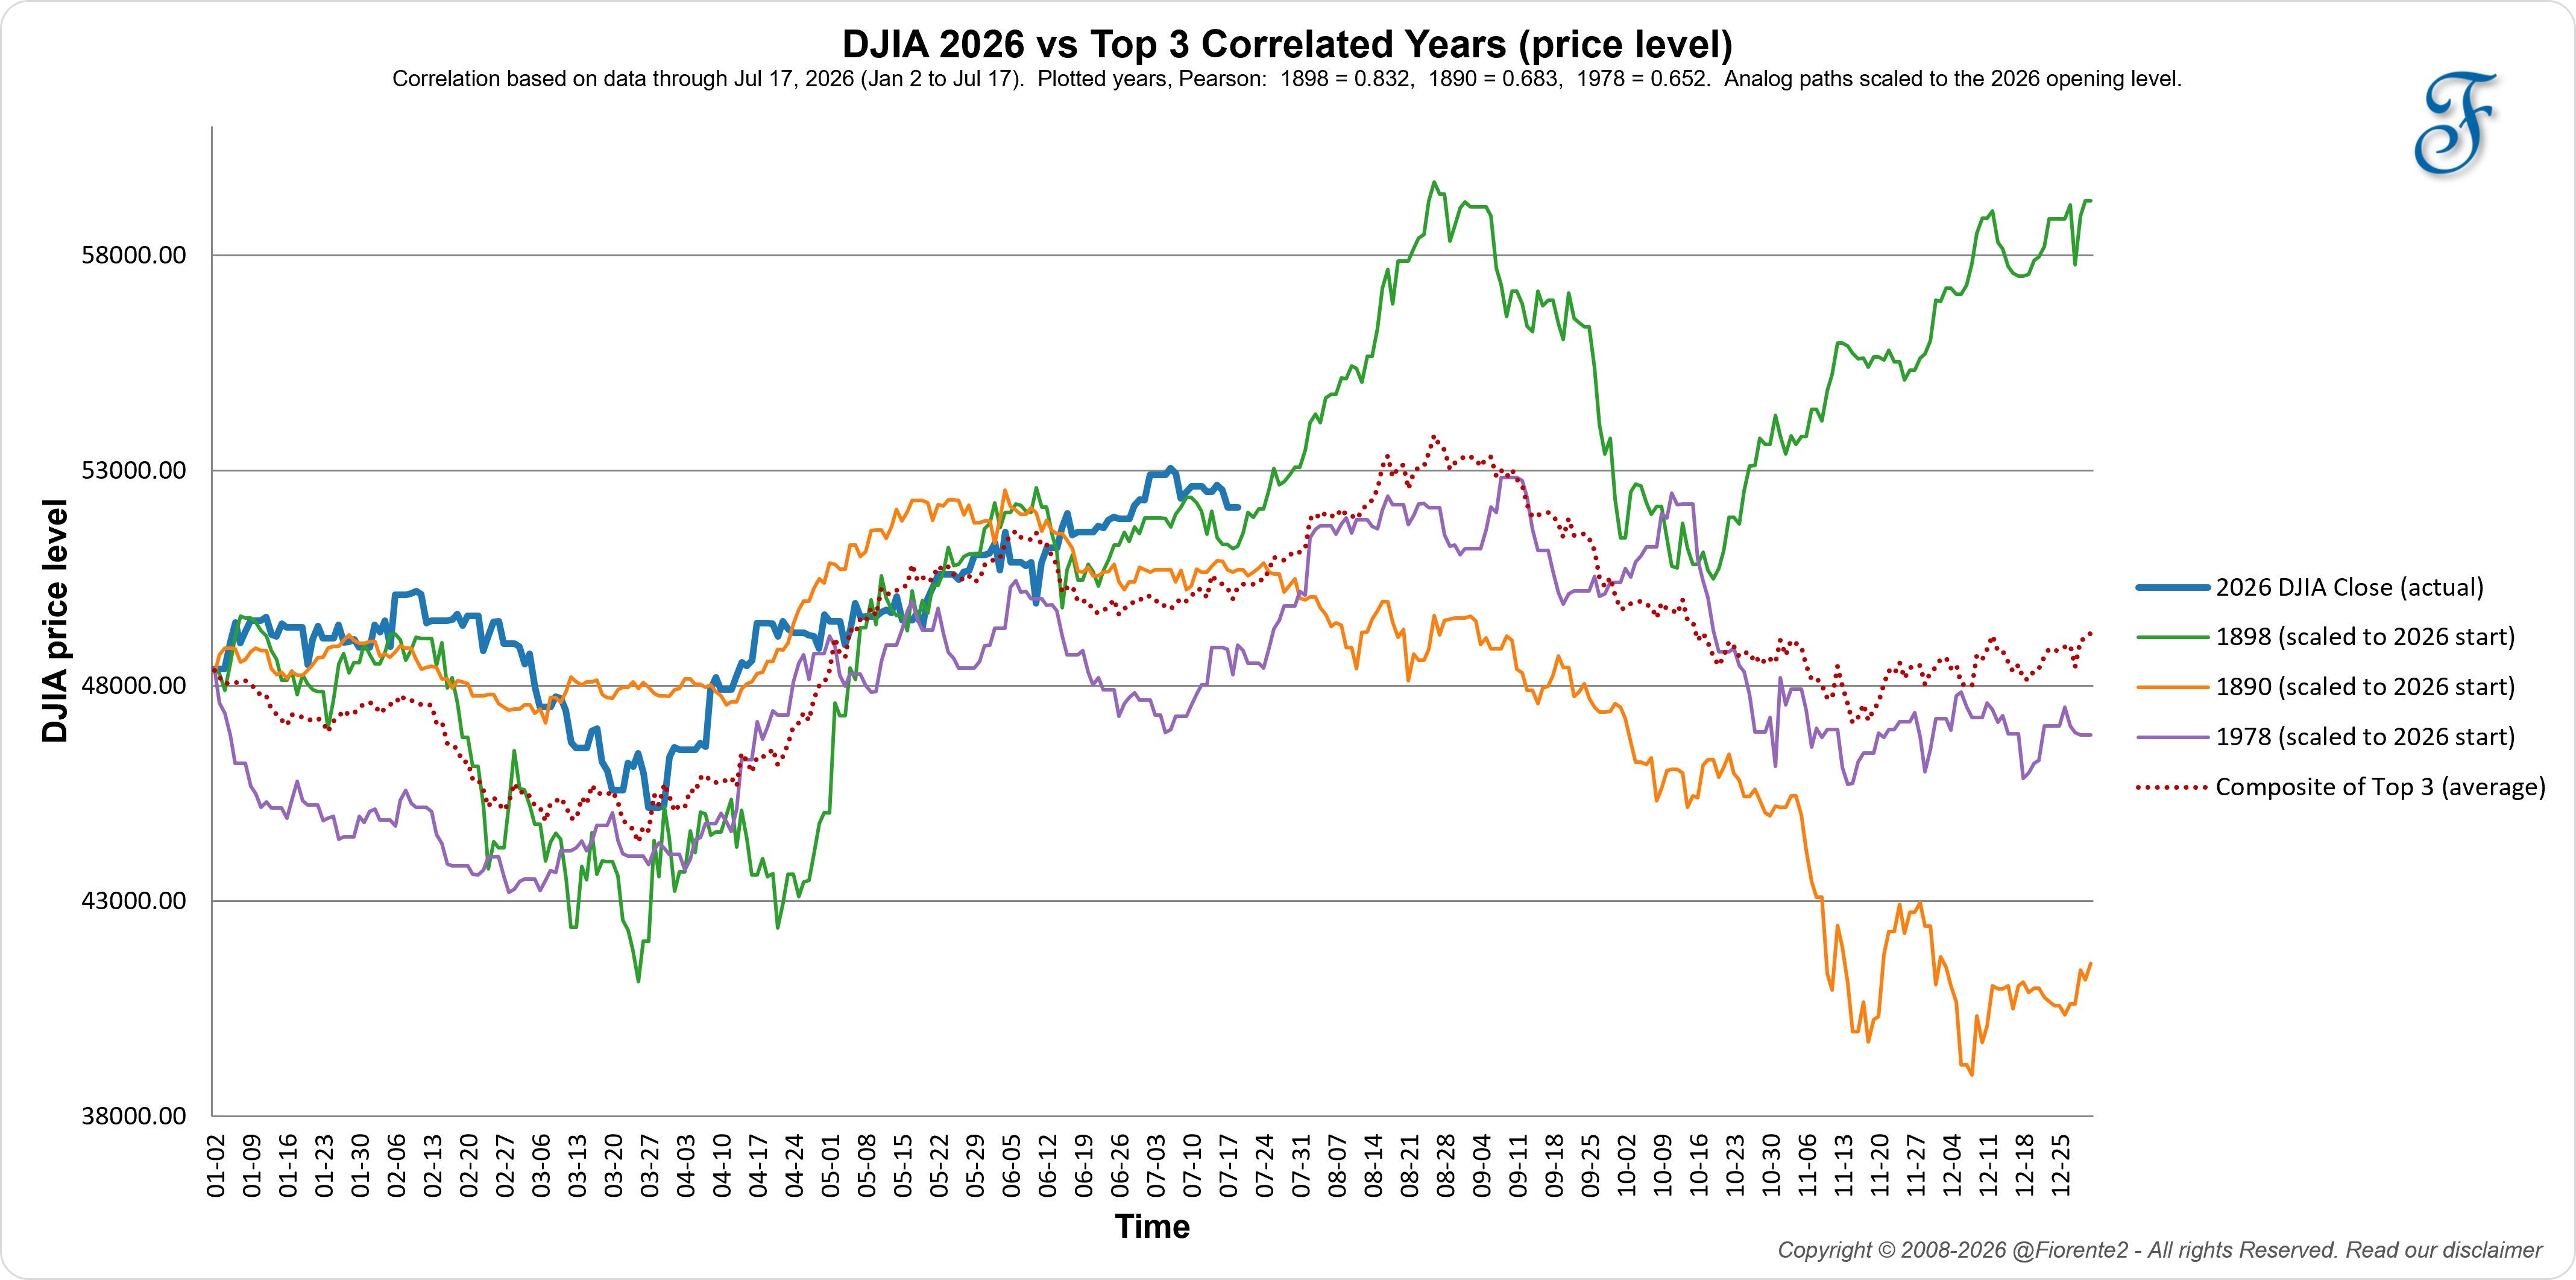
Here’s what the leader does next. In 1898 the index dipped through late July, ran to its year high on August 26, then fell into an October 19 low. So my strongest fit says one more push into late August, then the decline.
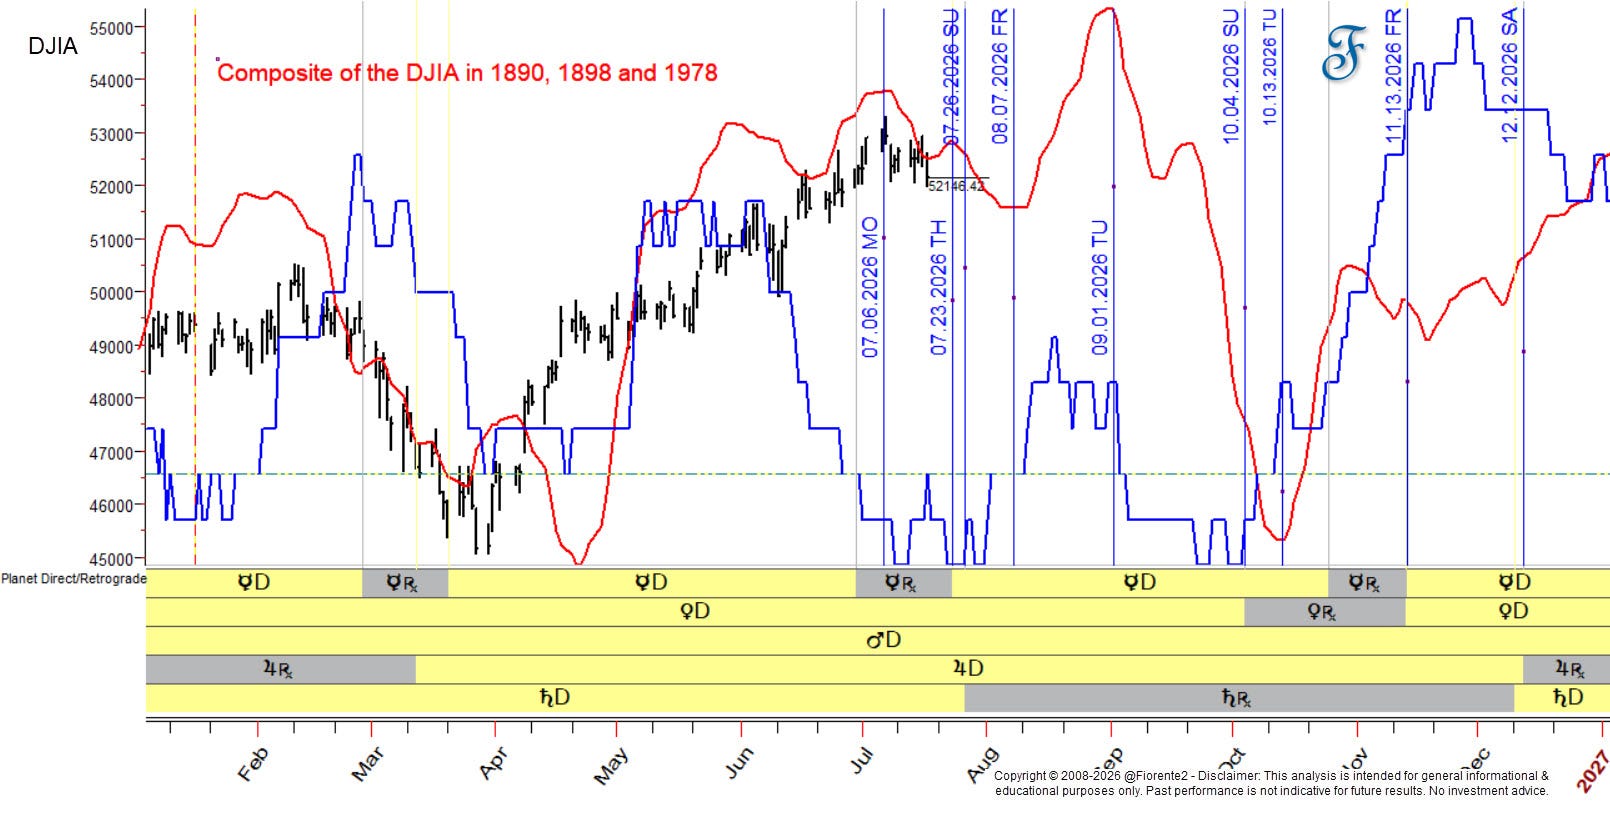
Chart 3 lays my composite against an index of cyclical variation (blue line). It tracks several planetary cycle relationships through their two halves: the waxing phase, while the two bodies separate, read as the more positive stretch, and the waning phase, while they close again, read as the more negative one. The two lines follow each other well enough here, which is why I keep it as a confirming layer. It can invert, so I don’t lean on it alone.
The year-6 zone, and lost motion
For his 1936 forecast Gann compared “the 6th year of the 20-year cycle, or the 6th zone, of the 10-year cycles. These years are 1866, 1886, 1906, and 1926” (Gann, Stock Market Course, 1955). All four turn in the autumn rather than at midsummer. That’s the method, not a schedule.
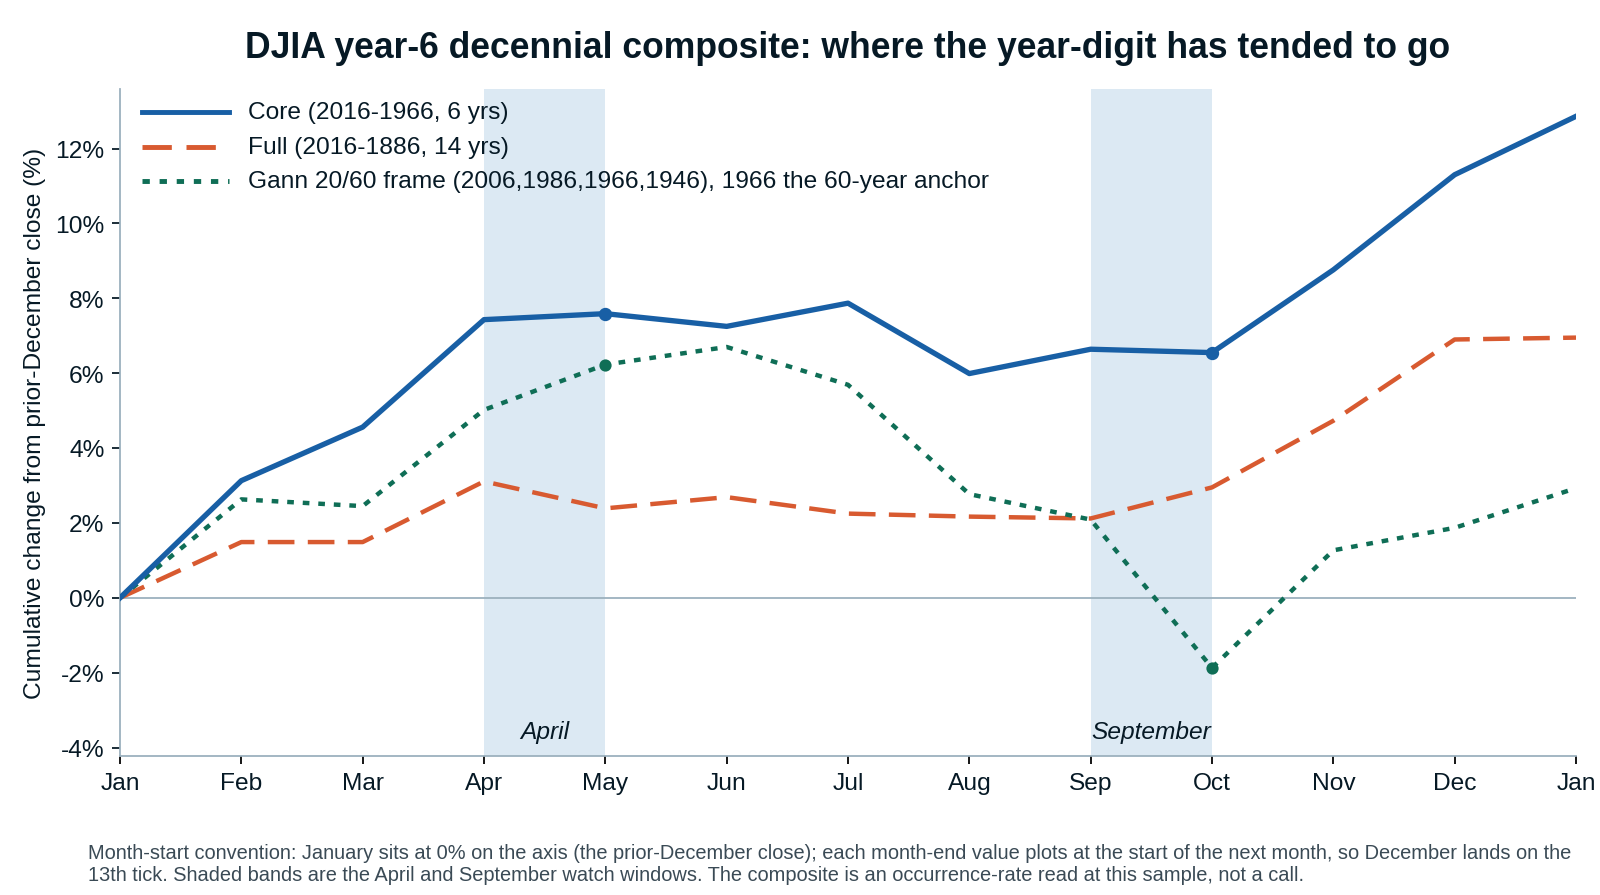
I run the same comparison for 2026, and chart 4 is that run. Three of his four years, 1886, 1906 and 1926, sit in my own year-6 set, and 1866 falls before my data starts. Stepping the same zone forward gives 1966, 1986, 2006 and 2016. Weighted the way he weighted it, to the 20-year and 60-year steps, that line peaks in May near 6.7% and troughs in September near -1.9%, the only read in the set that turns negative.
He allowed for the gap himself: “as there is lost motion in every kind of machinery, so there is lost motion in the stock market due to momentum, which drives a stock slightly above or below a Resistance Level” (Gann, Stock Market Course, 1955).
Time has lost motion too, and his best-known call shows it. For 1929 he ran the same comparison against 1869, 1909 and 1919, and “figured the top must come not later than the end of August and stated that a ‘Black Friday’ would come in September” (Gann, Stock Market Course, 1955). The Dow’s last August session was the 30th, high 383.96. The top came one session later, September 3, at 386.10. Two points past his boundary, and the fall decline followed.
So a June or July high and an autumn turn aren’t at odds, since the first can overshoot into the second. The cycle landings agree on the month: September carries 10 of them, eight major-cycle analogs low-side, on Gann’s autumn cardinal around the 22nd. Heaviest month of the year, though a month holding a cluster sits near a realized turn about as often as any month does.
The cube hasn’t closed yet
I've updated the chart I published last week in Squaring the Cube into Early August (#315).
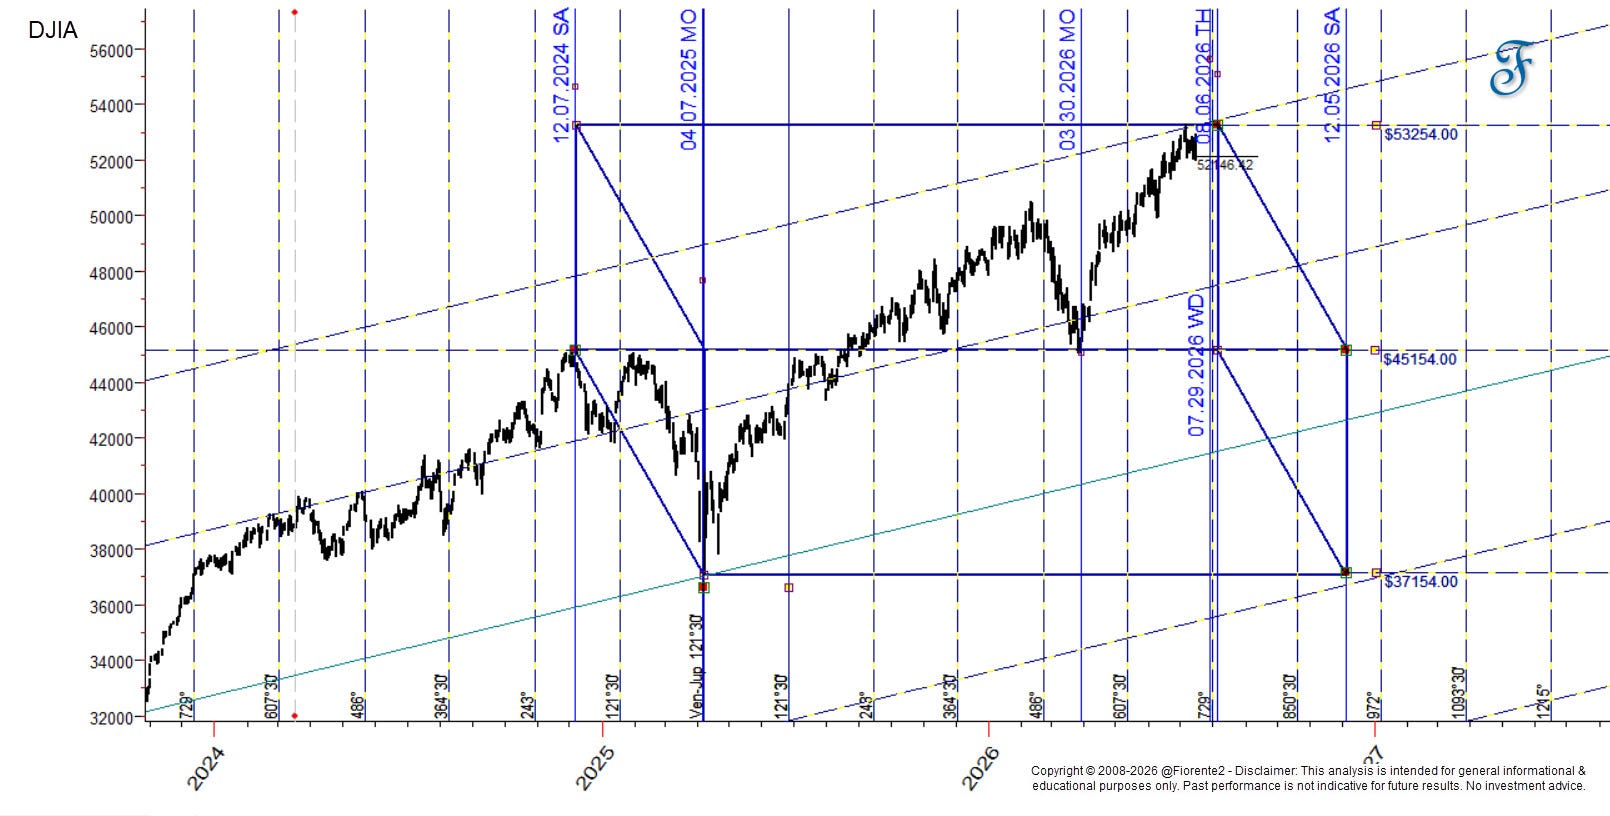
The cube's upper boundary sits at 53,254. On July 7 the Dow printed 53,289.30 intraday, 35.30 points above it, and turned back. Lost motion again, this time in price. But the face doesn't close until somewhere between July 29 and August 6, so there's room yet to work back up to that high on the back face. I may be wrong. I've also seen reversals come just before the cube corners, resolving into a low instead of the expected high, or vice versa.
Conclusion
The break of 52,500 is real. But a second-year market up nearly 8% at mid-July usually gets one more high, 10 times in 11, and 999.70 points sit open under the square of 233. So my preference is that the top isn’t in yet, August is the likelier month, and the autumn is what I’d prepare for. #309 called a July high and an early-August pullback, and both arrived on schedule. The August 21 date from #314 still stands.
Here’s what I’m watching, in order.
A close back above 52,500 keeps the 1898 path in front. A run into 54,289 inside the July 29 to August 6 window lands price and time together.
Below that, the Saturn 8x1 moving support (#314) is the first rung, near 50,000 to 51,000 into the autumn. It has held since the April 2025 low, so a close under it is the first sign I’m wrong.
Gann’s fan says the next angle catches it. That’s the Saturn 4x1, at 44,023 by October 10. Run the 1966 path forward from Friday’s close and the 60-year line reaches its own low on October 7, near 43,642. Two methods with nothing in common, 381 points and 3 days apart. Where they meet is where I’d say the 60-year cycle is back on track, not at the March low of 45,057.28, which sits 1,034 points higher. That’s the line.
I’d see it earlier in the gap closing, with the index turning down out of the August window while the 1966 path keeps falling. One caution: 1966 came into mid-July already down 7.7% and mid-decline, where 2026 is up 7.78% near its high. So 43,642 is where that path would sit if it resumes, not a target.
Each level is a place where the move may pause or turn. Always watch the chart in front of you.
This is my bias for now. Always keep in mind that cycles can contract, extend, or invert, and anomalies can arise. So, be careful out there. No advice.
Remember, cycles can contract, extend, and invert. I may be wrong, of course. Anomalies can occur, fundamentals can shift, so be cautious.
In case you haven’t noticed, I post various charts in the Substack notes every week. You can find them all here. (click on the link)
P.S.: The next update comes when the July 29 to August 6 cube window closes, or sooner if the Dow reclaims 52,500 and turns back up toward 54,289. If it rolls over from here instead, the 1890 path moves to the front and I'll reassess the analog set. Free subscribers get it by email from the day they join.
If you liked this post from @Fiorente2’s Blog, why not restack and share it?
© 2008–2026 Fiorente2.com. All Rights Reserved.
Disclaimer: This analysis is for informational and educational purposes only and should not be considered investment advice. Read our full disclaimer.
Disclosure: From time to time, I may hold positions in the securities mentioned.