
DJIA - The First Checkpoint
#309 | Tracking the mid-year forecast: the Dow reached its September target early, but the S&P 500 lags behind.

Introduction
In my “2026 Mid-Year Forecast” (#308, June 14), I laid out a path for the second half of 2026. It came from three older years that look like this one: 1890, 1898, and 1978. I will call them the analog set, the past years whose pattern is closest to now.
That path pointed to a July high, a small pullback in early August, a high near 52,000 around September 1, and a low near 46,200 in October.
Five days later, the Dow has already traded near 52,000. The market is running ahead of the forecast, which is worth a closer look.
DJIA - Where the first half left us
The first half gave us two clear turns. The Dow made its high near 50,500 on February 10, within a day of the 60-year high back in February 1966. It then fell to a low of 45,057 on March 30, down about 10.6%. My earlier cycle analysis flagged both turns in time, so the cycle did its job.
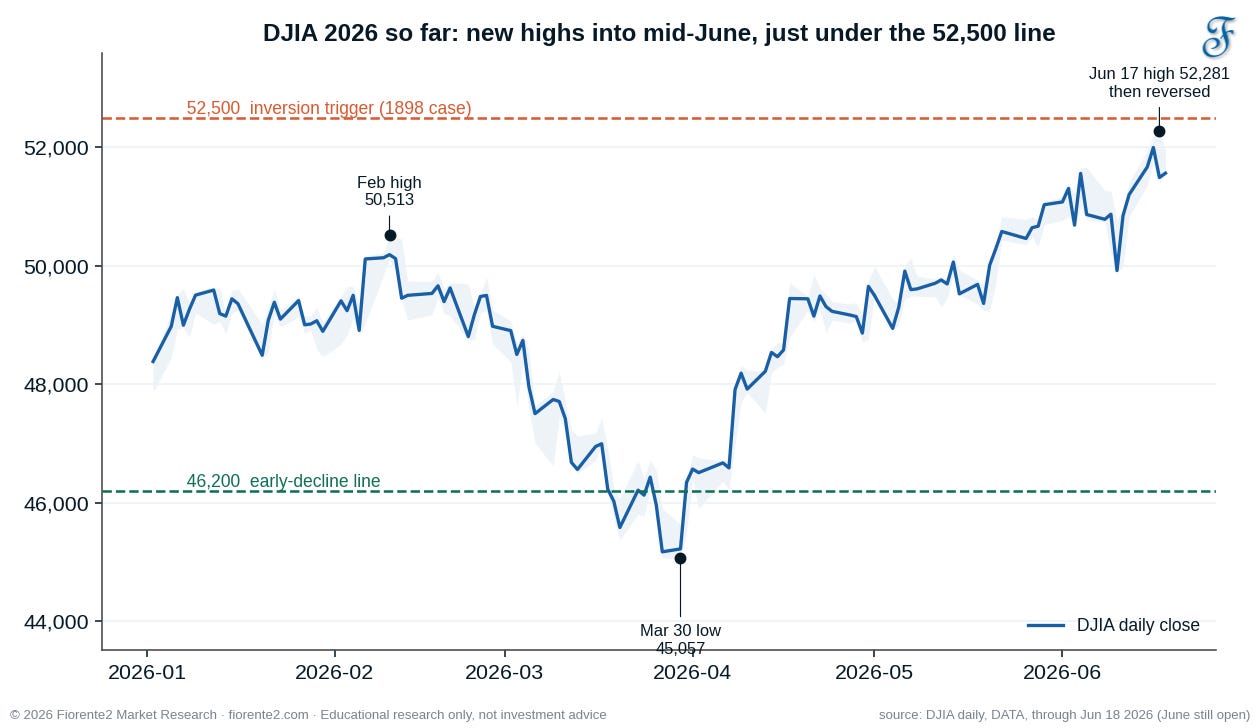
After that, the market did not follow the 1966 analog lower. The Dow kept rising, so the 60-year cycle looks to have inverted. It made a new closing high of 51,999 on June 16 and reached 52,281 on June 17 before turning back and closing near the day’s low. By June 18, it sat at 51,565.
Two price levels are important to watch. A daily close above 52,500 would tell me the pullback is not coming, and that the market is tracking the stronger 1898 year. A daily close below 46,200 before September would tell me the autumn decline came early. Neither has happened yet.
The path I’m tracking
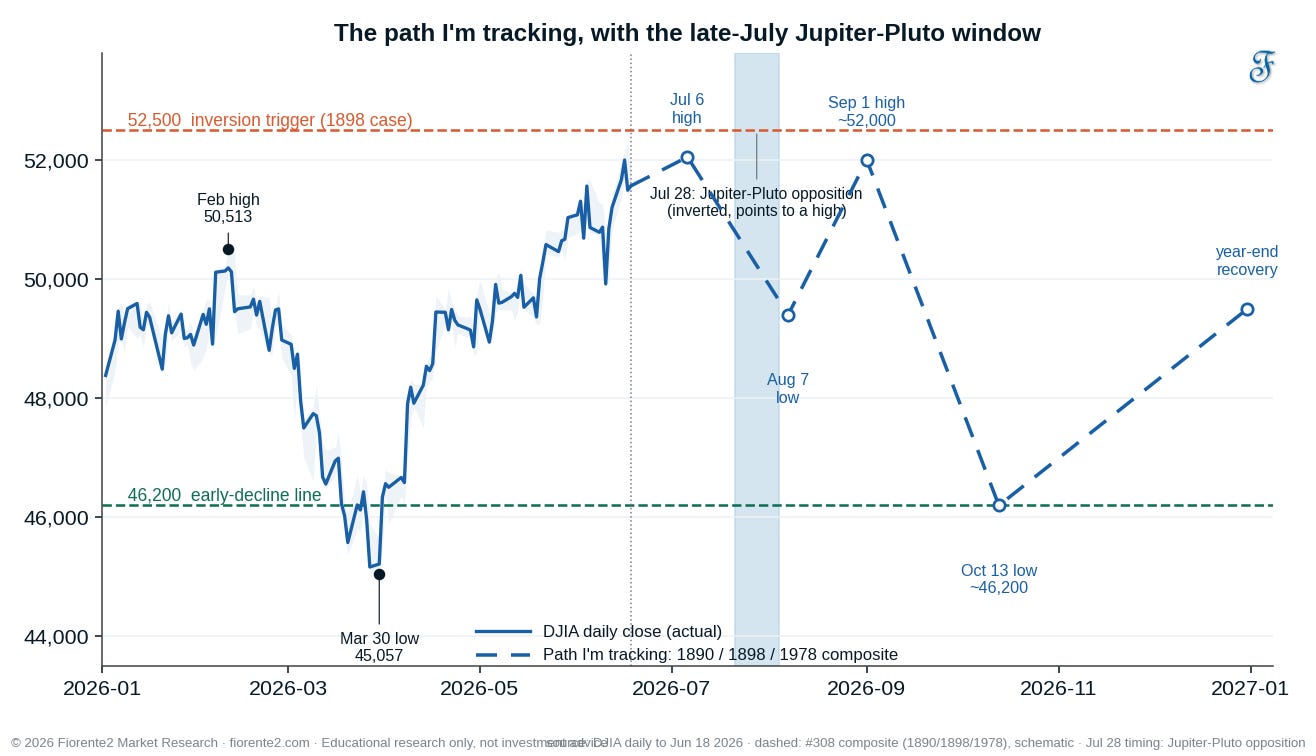
In last week’s post (#308), I set the plan and the exit levels in the same place so you can compare them to price. Here it is again:
A July 6 high
A small pullback into an August 7 low
A run back up to a September 1 high near 52,000
A decline into an October 13 low near 46,200
A recovery into the year-end
These are probability windows, not exact dates. June is not finished, so the June high can still move.
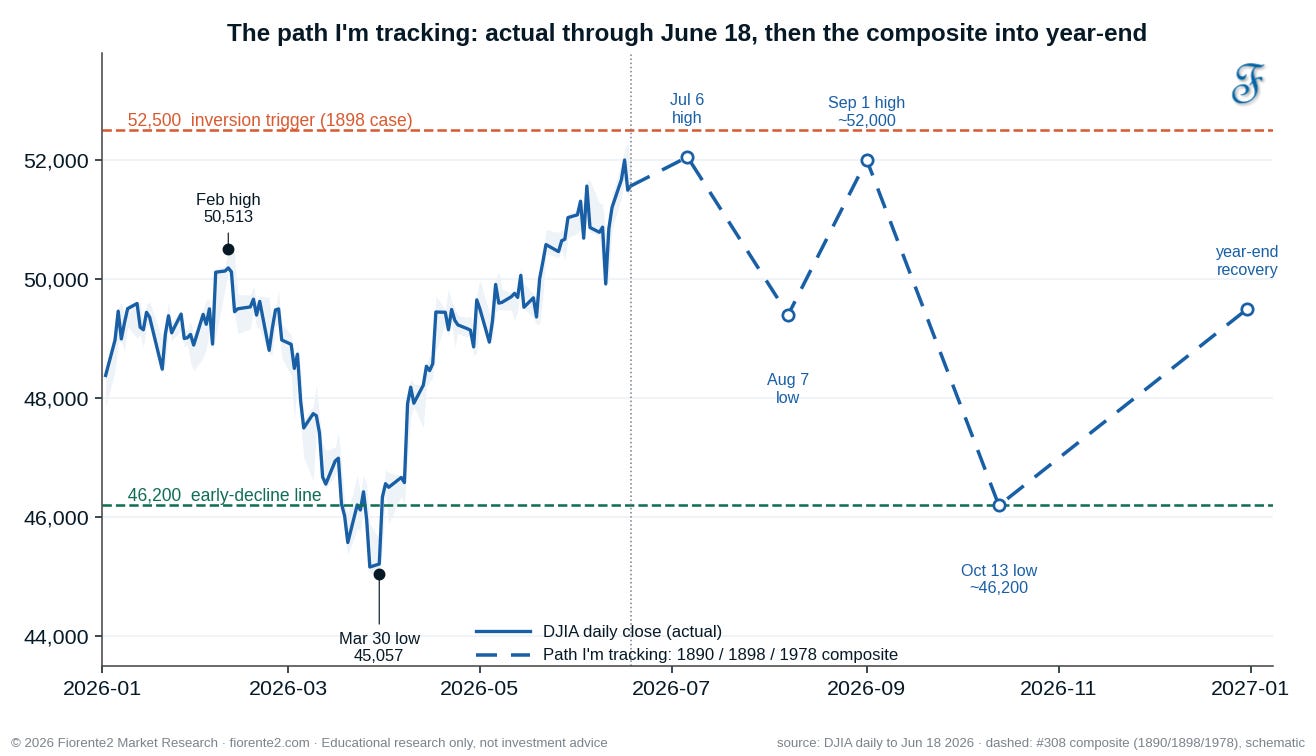
The dashed line shows the path, with each turn from last week’s (#308) post marked. I have marked only the hard levels I named, near 52,000 at the September high and near 46,200 at the October low. The July and August turns mark only timing, so I’ve left them without a price forecast.
The early arrival is the change. My forecast put the 52,000 area in September. The Dow reached its high in mid-June, about two and a half months early. When price runs that far ahead of the slower, weaker path, my bias is toward the stronger year in the analog top-3 years: 1898. The 52,500 line is the test. Until the Dow closes above it, I will keep the pullback on the table.
One index falling short
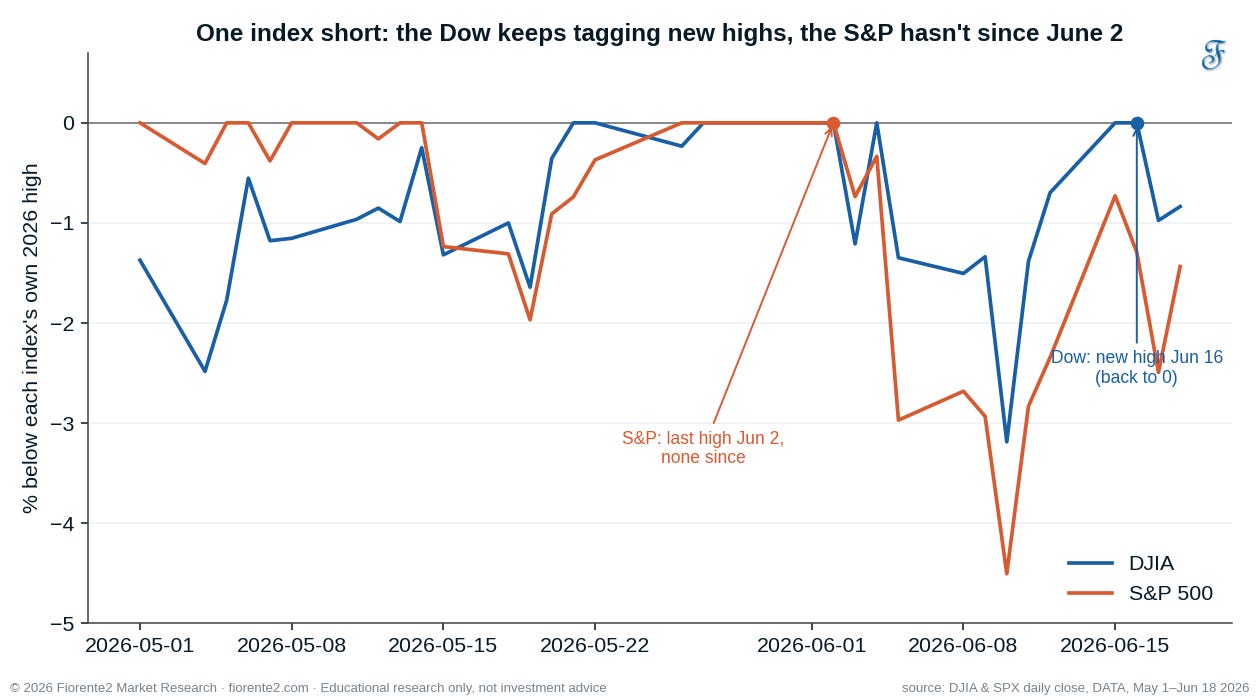
The Dow keeps making new highs, but the S&P 500 does not. The S&P set its 2026 high on June 2, near 7,620. Since then, it has not gone past that level, even as the Dow pushed to fresh highs into June 17.
The chart below shows each index as a percentage below its own top. The Dow comes back to zero again and again, the last time on June 16. The S&P last touched zero on June 2 and has stayed under it.
In the next chart, I plotted both indices on a single chart, in actual points. The black lines connect each index’s early-June top to its recent top. The Dow’s run-up is a higher high. The S&P runs down, a lower high. A higher high on one index and a lower high on the other, over the same weeks, is the divergence. I’ve used two axes because the Dow trades near 51,000 and the S&P near 7,500, so the scales differ.
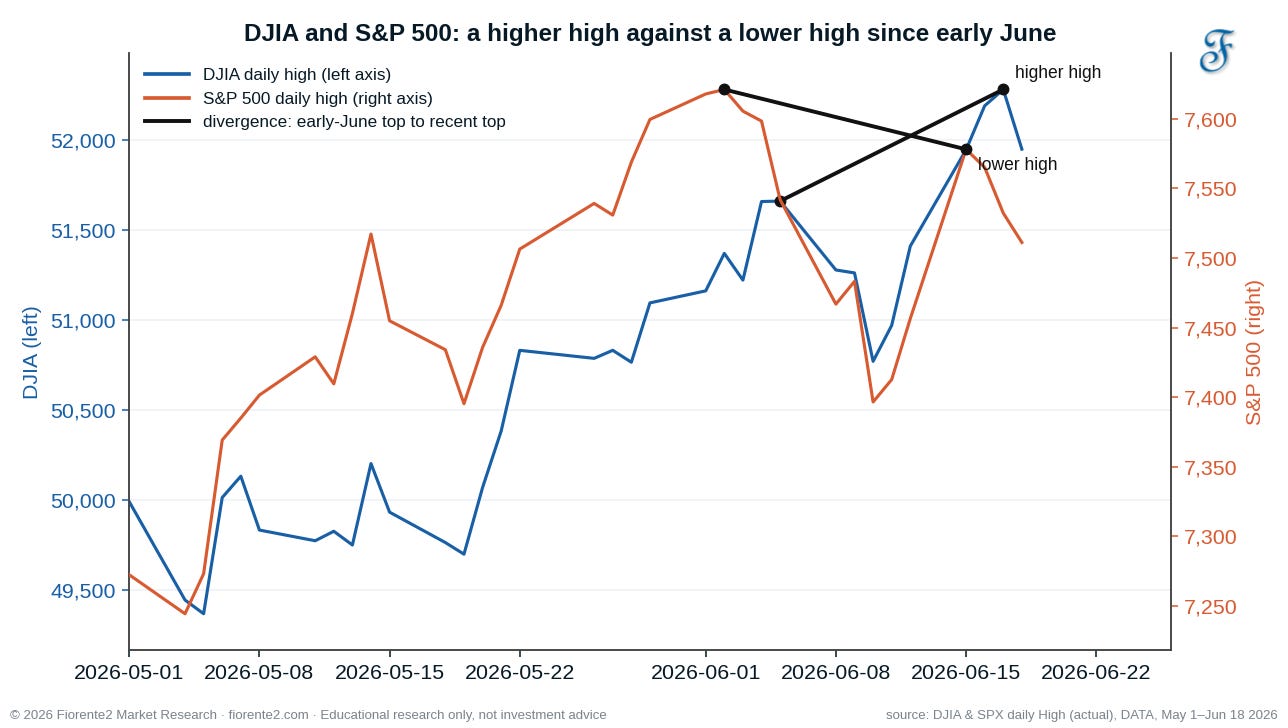
When one major index makes a new high while the other does not, that is a warning sign. It keeps the early-August pullback alive. So I am adding a third line to watch: if the S&P clears 7,620, that would confirm the Dow’s strength. If it keeps failing there while the Dow stalls, the pullback may be starting.
When the cycles cluster
Last week I also ran a separate test. This one counts Gann’s fixed-time cycles forward from past turns and asks which months in 2026 get the most hits. It uses no correlation at all, so it is a fully independent check on the analog set.
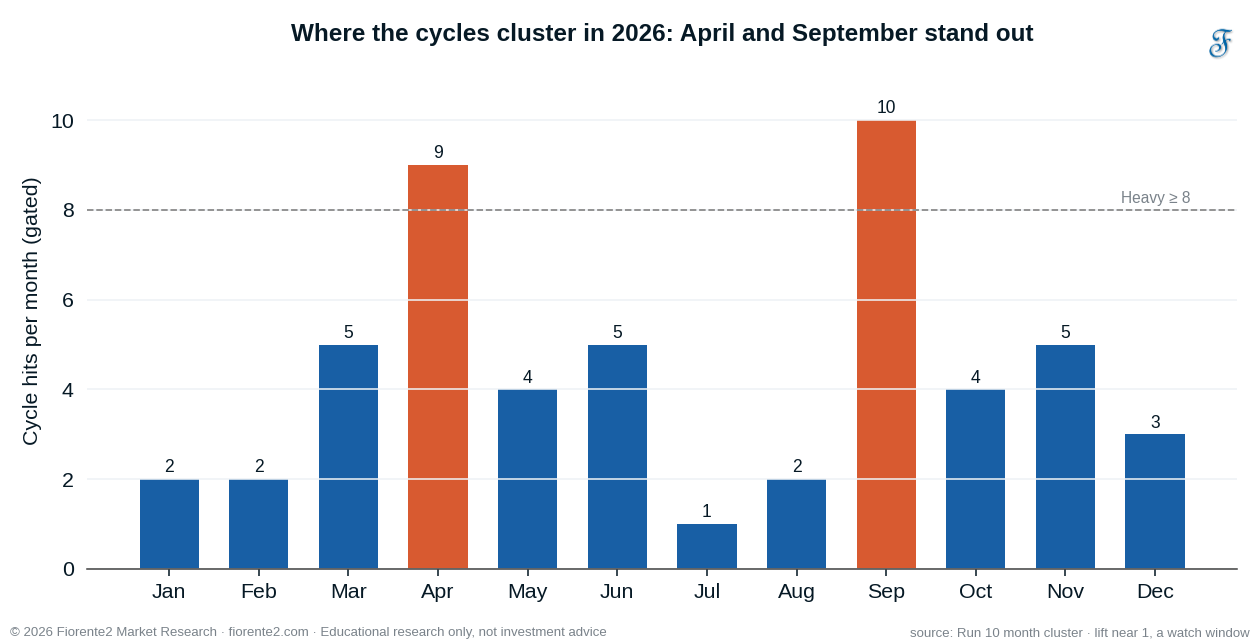
Two months stand out: April and September. September is the heaviest month of the year, with 10 hits. Of the long cycles that land there, eight are lows, led by the 60-year 1966 line, and the month sits on Gann’s autumn date around September 22 to 23. So this method, from a different direction, points to the same place as the analog set: an autumn low.
One caveat on this chart I need to share with you. In my earlier tests, a month with a heavy cluster sat near a real turn roughly as often as any month does. So I read April and September as windows to watch, not as fixed dates. A cluster is one signal. I want at least two more lined up before I trust it.
The split under September
The cluster tells me when a turn may come. It does not tell me whether it is up or down. For direction, I have chosen the years ending in 6 and plotted three different lines.
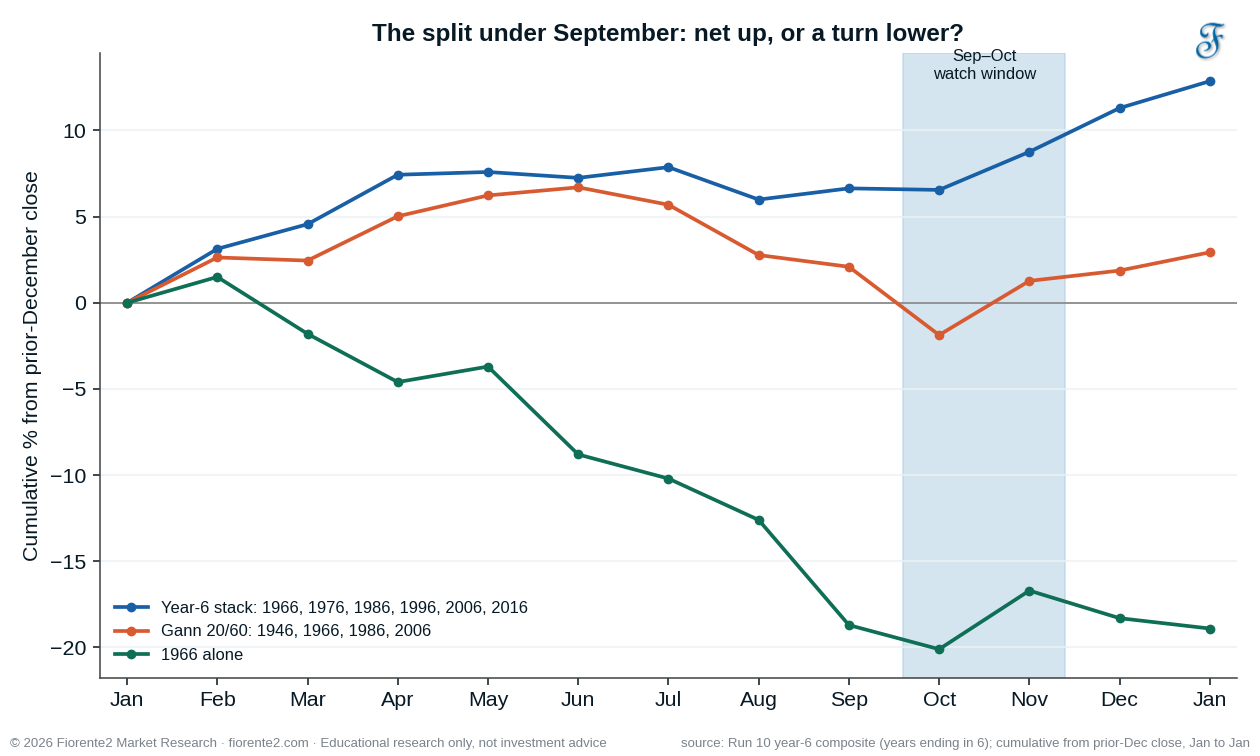
The three lines split, and that split is the real story. The broad set of year-6 years, the decennial pattern (1966, 1976, 1986, 1996, 2006, 2016), runs up into the close, near +13% by December, and has finished higher 5 of the last 6 times.
The Gann 20/60 set (1946, 1966, 1986, 2006), weighted to the cycles Gann trusted most, is the only one that turns down in September. And the 1966 line on its own falls all year, from a February 1.5% high to about -20% by September/October.
So, September/October reads two ways. Under Gann's own weighting, it is a high, then a turn lower. Under the decennial pattern, it is just cycle weight with no clear direction until September/October, then a higher high into the end of the year. That split is real, and for now, I hold it as a bias and wait.
The next windows
A planetary timing layer sits just ahead of those, in late July. The Jupiter-Pluto opposition (the two planets 180° apart) lands around July 28. It’s a hard aspect, the kind where reversals can occur. It’s also an irregular cycle. In the recent record it has run inverted, so where it once marked lows it now points to a high.
In 6 of the last 12 oppositions a turn came inside a two-week window. That’s an even split, no edge on its own, so it earns its place only because it sits right next to the composite’s late-July high and the early-August low that follows. A daily close above 52,500 through that window would tilt the read back to the stronger 1898 path.
The first low window is early August. Gann’s seasonal date of August 8 sits right next to the analog set’s August 7 low. Two methods, one window. My cycle run is light in August, so the weight there comes from the season and the analog set; the fixed cycles add little.
The bigger window runs from late September into October. The analog set, the seasonal date, my cycle cluster, and the 60-year turn all point there. When two independent methods land on the same autumn low, that is the part of the forecast I would give the most weight.
I will also close an old call. In an earlier post, “Wheels Within Wheels” (#303), I named a possible July low near 42,149. The market instead cleared its February high, so that low is off the table. The inversion won.
Each level is a place where the move may slow, pause, or turn. Always watch the chart in front of you.
Conclusion
The forecast from my 2026 Mid-Year Forecast (#308) still stands, but the balance has shifted. The Dow reached its September target in mid-June, which leans toward the stronger 1898 year, while the 52,500 line has held it short of a full confirmation. The S&P has not made a new high since June 2, which keeps the early-August pullback in play. And two separate methods agree on an autumn low in late September or early October.
So my preference for now is the analog path into the August window, with 1898 as the stronger case that the Dow is flirting with, and the S&P as the index that has to confirm. The August window should settle which way it goes.
This is my bias for now. (No advice.)
Remember, cycles can contract, extend, and invert. I may be wrong, of course. Anomalies can occur, fundamentals can shift, so be cautious.
In case you haven’t noticed, I post various charts in the Substack notes every week. You can find them all here. (click on the link)
P.S.: I will post the next update when the August window opens, or sooner if the Dow closes above 52,500 or the S&P clears 7,620. Free subscribers get it by email from the day they join.
If you liked this post from @Fiorente2’s Blog, why not restack and share it?
© 2008–2026 Fiorente2.com. All Rights Reserved.
Disclaimer: This analysis is for informational and educational purposes only and should not be considered investment advice. Read our full disclaimer.
Disclosure: From time to time, I may hold positions in the securities mentioned.