

Introduction
In last week’s post DJIA - The dip that may only be a ripple (#314), I flagged a squaring of Fibonacci numbers that seemed to line up with an upcoming price and time confluence. This issue gives you the geometry behind it.
The square of 144 is 20,736, a level the Dow tagged as it turned up from the days around the COVID low of March 23, 2020: the next session’s high printed 20,737.70, within 2 points of the square. The square of the next Fibonacci number, 233, is 54,289. And 10 times 233 is 2,330 days. Counted from that March 23, 2020 low, 2,330 days lands on August 9, 2026, right in the window I’ve been watching.
Since #314 the Dow has pushed on. It closed at 52,637 on July 10, 2026, after a fresh high near 53,289 on July 7, and it holds above the 52,500 line I set in DJIA - The First Checkpoint (#309), so the larger read still favors the 1898 analog, which leads the set at r 0.81. The S&P 500 is still the caution, holding under its early-June high, and that split keeps an early-August pullback in play even with the Dow out front.
The golden ratio
This may be coincidence. But growth in nature often tracks the golden ratio of 1.618, and markets tend to move the same way. The ratio between the square of 144 (20,736) and the square of 233 (54,289) is 1.618.
As price and time close in on the square of 233, that shows the parabolic rise, a move that spirals with the Fibonacci sequence. The jump from 20,736 to 54,289 is that advance in two numbers.
That August window matters because you can read the advance as a three-dimensional cube, with the Dow heading toward the top-left corner of the back face. The cube closes one of its faces into the last days of July and the first days of August, right up against the August 9 Fibonacci node.
I’ll walk you through what the cube is, why the window runs about a week either side of August 6, the Venus cycle that sits under it, and why the cube reads this as a possible crest, the top of that Fibonacci run, rather than the minor dip I first had in mind.
The cube, in plain terms
There are several ways to build a cube. Gann built the market up the way you build anything, a floor, four walls, and a roof. Six faces. Each face on his Square of Nine holds 81 numbers, and 9 times 81 is 729, what he called the cube of nine. Divide that cube by six and you get six equal faces of 121.5 days each (that 121.5 is one-sixth of the 729-day cube). Those face boundaries are the turn windows, as the chart below shows.
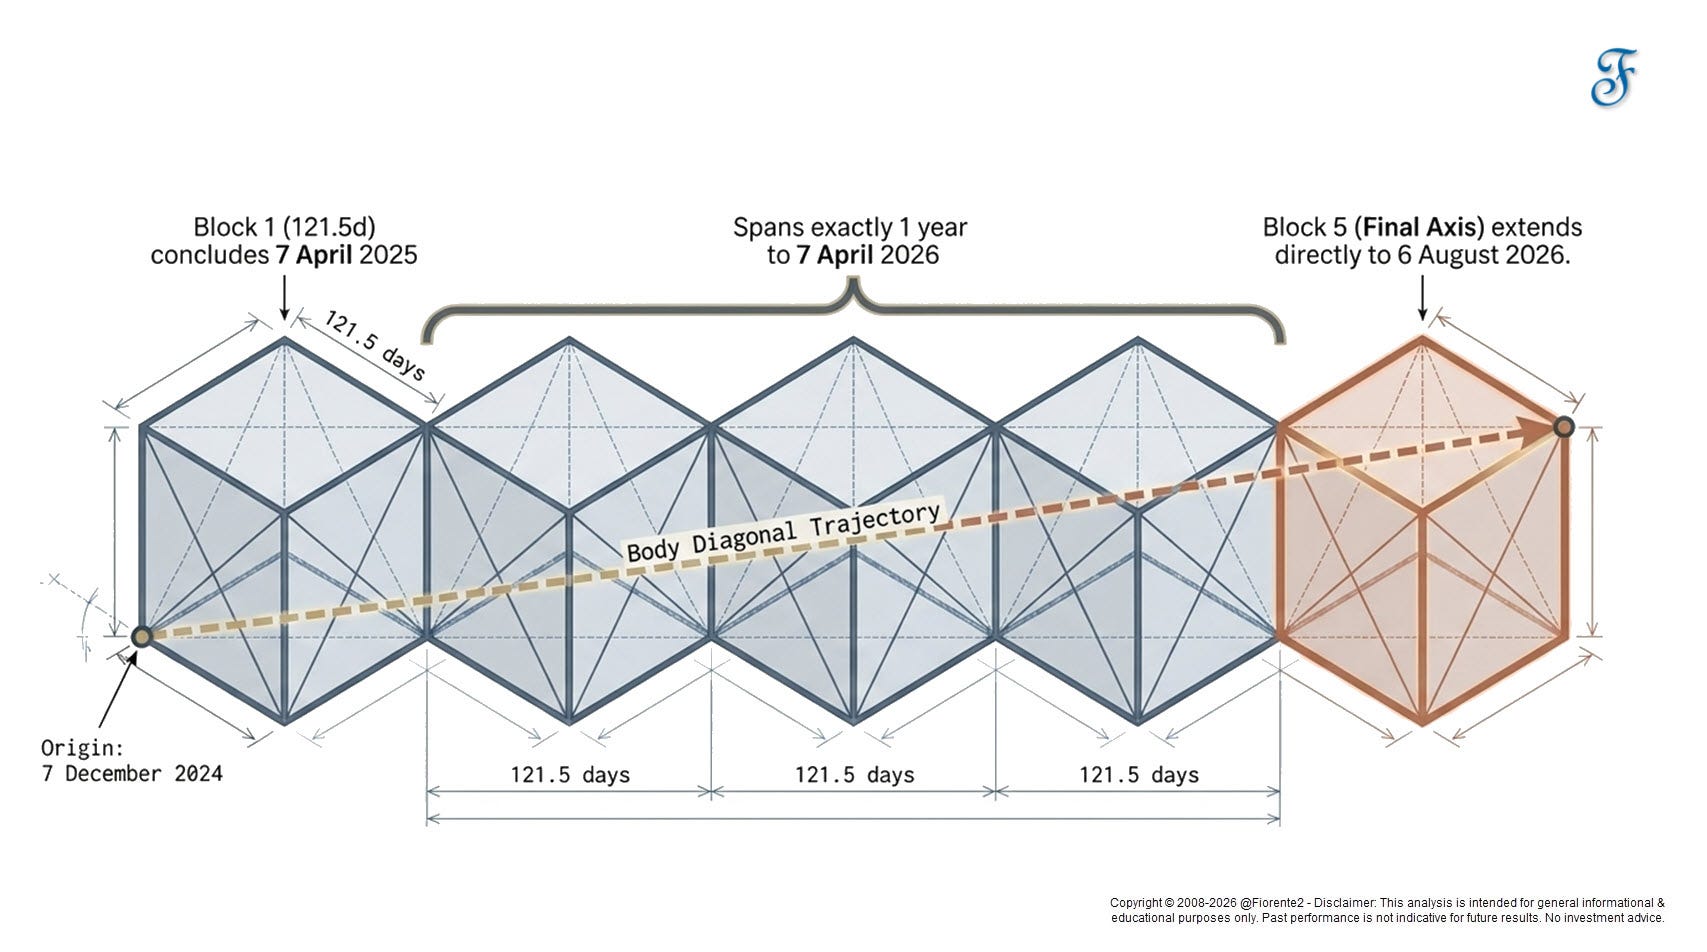
I’ll say up front that I haven’t tested the cube against a century of turns yet, that’s the next study on my desk. Each face boundary is a place to look, and confirmation still has to come from the chart. What I can show you today is where the methods agree.
Gann worked the cube flat, unfolded onto the chart, each face stacked after the last. The anchor is the December 2024 top. The record close came on December 4 at 45,014, and I run the cube from December 7. That date sits 121.5 calendar days from the April 7, 2025 low, and over that same span Venus and Jupiter separated by 121.5 degrees heliocentric, the angle that builds one cube face. So the first vector lands where planetary time and calendar time meet. December 7 wasn’t a trading day, but planets don’t pause on the weekend.
Why early August
Count one face of 121.5 days from December 7 and you land on April 7, 2025, the intraday low the Dow made that spring at 36,611. Four faces out, 486 days, brings you to April 7, 2026, about a week past the March 30, 2026 pivot low at 45,057. And here is the reason for this letter: five faces, 607.5 days, lands on August 6, 2026. A separate 121.5-day face counted from the March 30 pivot lands on July 29, 2026 (chart 2), which opens a week-wide window into that early-August date.
As I noted last week, that same March 30 and April 2025 pair is where my Saturn 8x1 moving support originates, the rising line that held the March low. So the cube’s corners and the timing line I already run mark the same pivots, read two ways.
Bradley Cowan read the same cube in three dimensions, running the trend as a line through the solid and measuring it by its body diagonal. Plotting a three-dimensional cube on a flat surface is an art that takes practice, but my Timing Solution software made it possible, as the chart below shows.
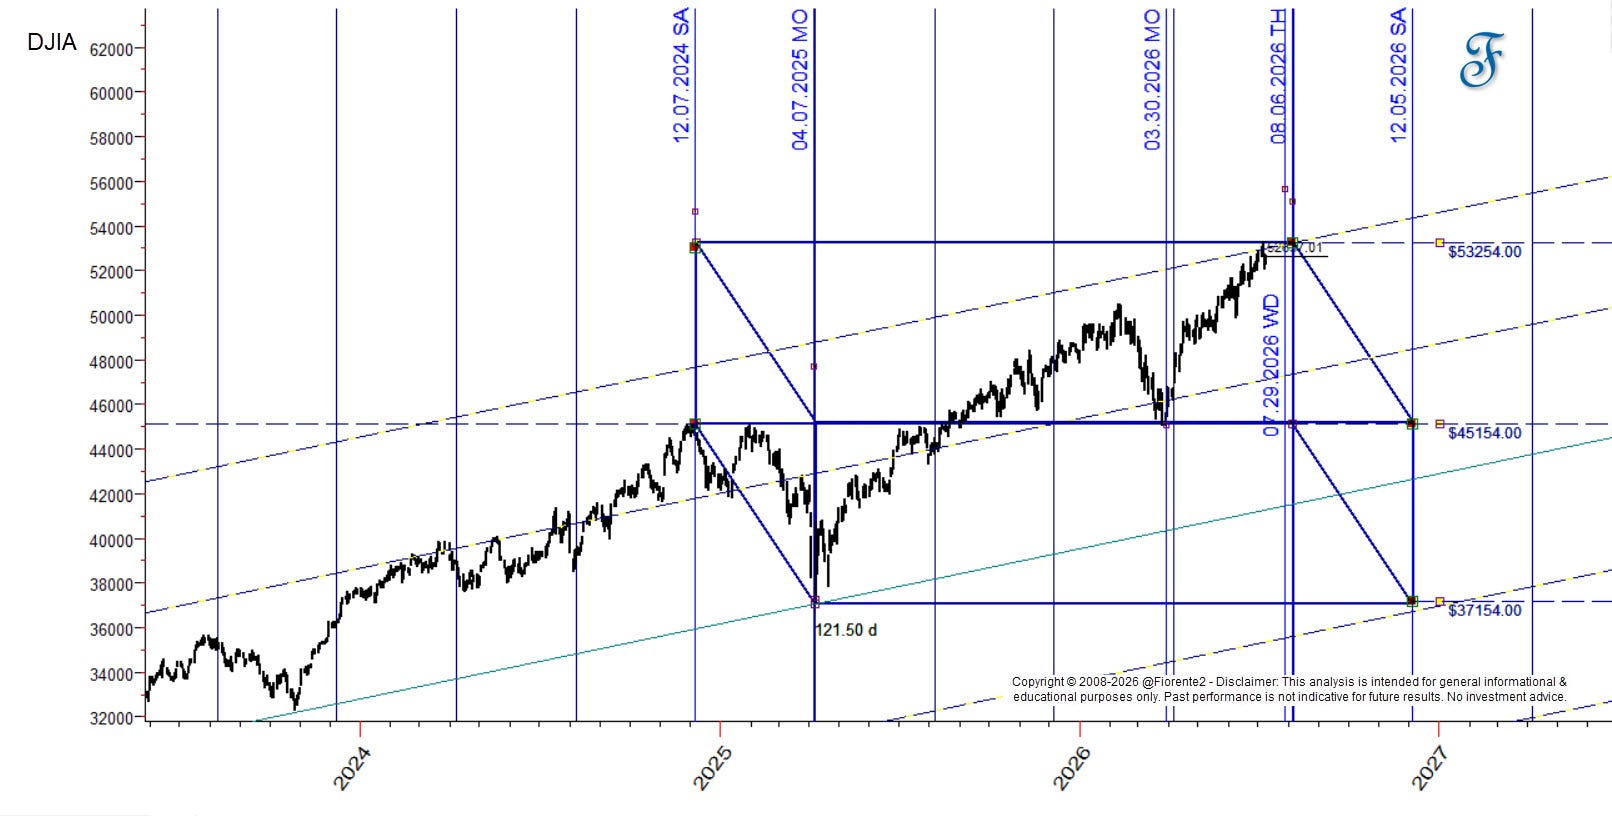
I’m not certain the degrees on the chart above can be swapped for days one for one. But 729 degrees of Venus-Jupiter separation also lands in the late-July to early-August window, and 729 is the square-of-nine cube (9 x 81). Gann taught that time can be measured in days or in degrees, so the same window is worth watching both ways.
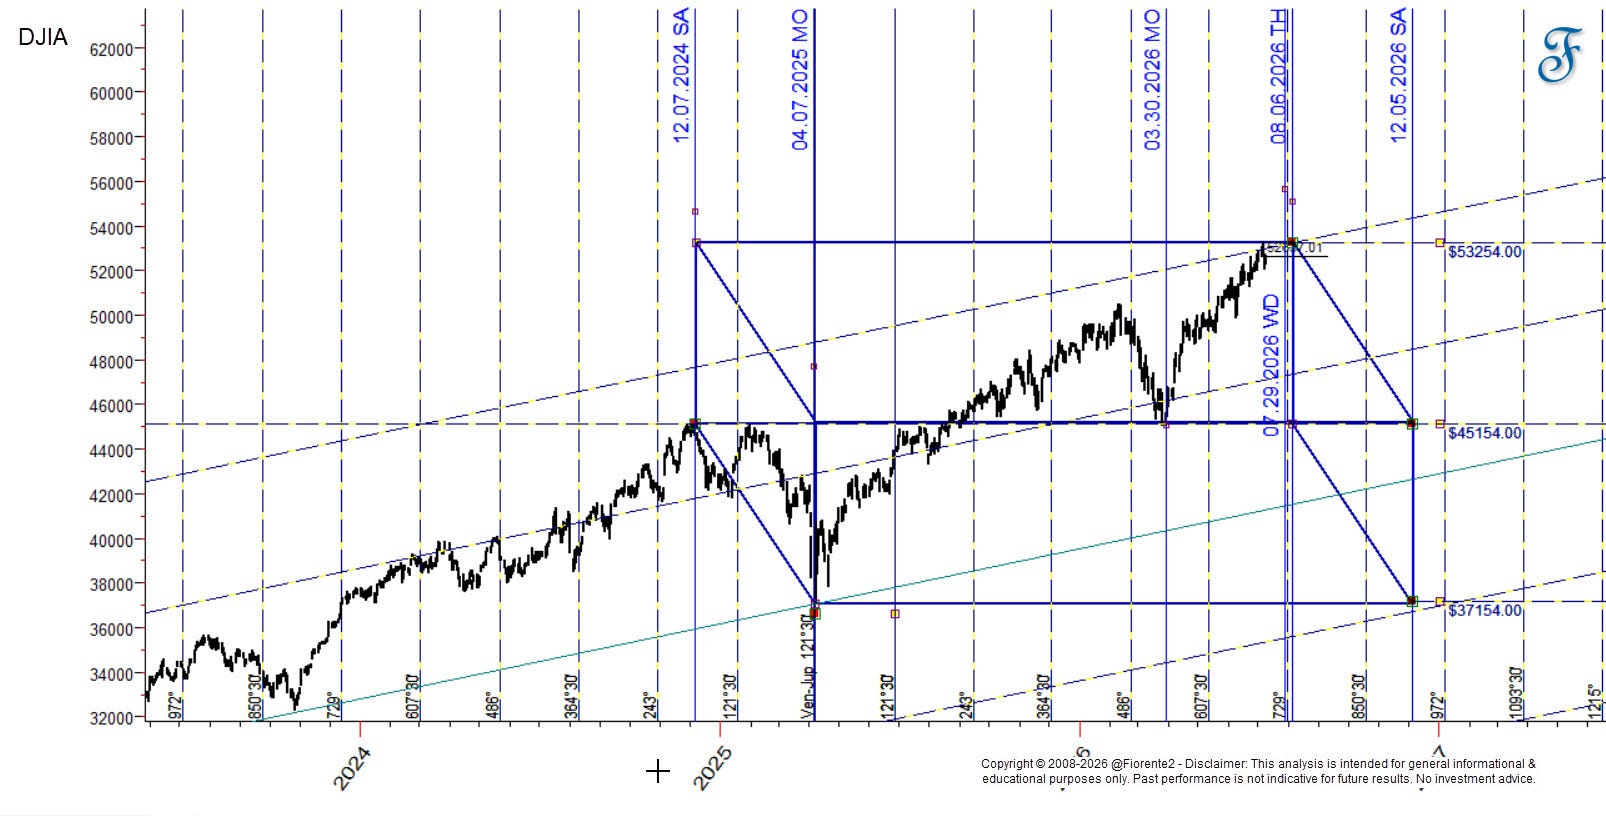
The late-July to early-August window is a band rather than a single day, and two counts widen it. A fresh 121.5-day face from the March 30 pivot gives July 29, a week before the 6th. And six identical 121.5-degree steps of Venus-Jupiter from the April 2025 bottom, 729 degrees in total, also land in early August 2026.
Push the far edge to the August 9 Fibonacci node and the band runs July 29 to August 9 on the tight reading. Gann named his turns in small ranges like this throughout his work, so the band is in keeping with the method.
The secular trend cube
The current trend starts from the October 2022 low, so a larger cube for the secular trend can be drawn in Cowan’s three-dimensional style.
This larger box is a rectangular cube in Cowan’s sense, its edges unequal, so a degree count and a day count can measure different edges without clashing. At the October 4, 2022 low, Venus and Jupiter stood about 176 degrees apart heliocentric, close to opposition. Twelve steps of that 176°07’ separation cover about 2,113 degrees of relative motion and land on July 31, 2026. Each step runs just under 180 degrees, which is what drops the twelve into early August rather than late.
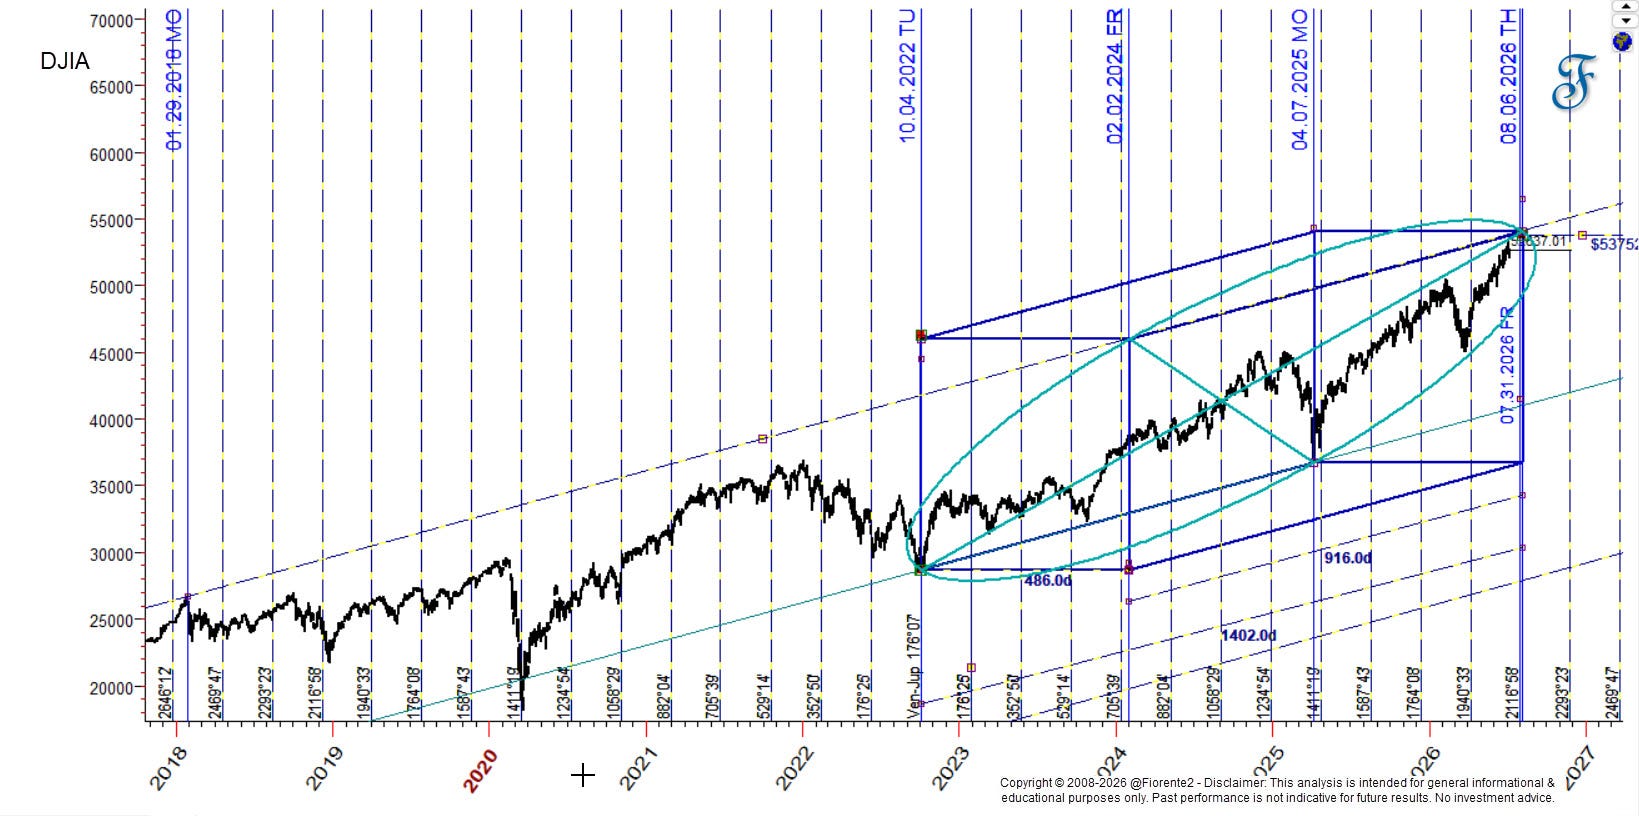
October 2022 was the bear bottom, and October 4 was not the exact low, the intraday bottom came nine sessions later on October 13 at 28,660. I anchor on October 4, and that slack is the point. The 486-day vector out to February 2, 2024 reads as the cube’s body diagonal, which makes the side 486 divided by the square root of 3, about 280.59 days. Five of those sides run about 1,403 days (the chart marks 1,402 d) and land August 6 to 7, 2026 from the October 4 anchor. From the true October 13, 2022 low the same math lands August 16.
So the day count and the degree count agree on one window: twelve Venus-Jupiter steps of 176°07’ reach July 31, and five body-diagonal sides reach August 6 to 7. Six days apart, both inside the same band. That spread is why I read early August as a window of roughly a week either side of the 6th rather than one day.
The counts from the shorter and larger cubes, in degrees and in days, together with a Fibonacci count, all point at one window, which raises the probability of a turn in that zone.
The Venus cycle underneath it
There’s one more layer, and it’s the one I find hard not to mention. Venus turns once on its axis every 243 days. Half of that is 121.5, the cube’s face. So the cube is a Venus grid too, each face half a rotation of the planet. The August 6 node sits at two and a half Venus rotations from the December top.
Push the same cube out and it keeps lining up. Its full close in early December 2026 falls at three Venus rotations, almost exactly two Earth years, and 60 degrees of Jupiter’s orbit, the same 60-degree division Gann cut his cube by. This is the same body I track with the Venus 8x1 line and the heliocentric cluster in #314, just read off the cube instead of the chart.
I can’t test it against price for you yet, so I hold it as one more confirming layer while the market confirmation is still ahead. When four methods land on the same window, that’s a confluence zone where an inflection point may show up.
The window, and what would break it
Taken together, the Fibonacci count, Gann’s and Cowan’s cubes, and the Venus grid all point at early August. When two anchors of geometry, a Fibonacci rhythm, and a planetary beat land within a week of each other, that’s a hotspot worth watching.
Read against my article DJIA- The dip that only may be a ripple (#314), this is the early-August turn I already flagged. What’s changed is how I read it. In #314 I had it as a minor pullback with a late-August crest near 55,968 still ahead. The Fibonacci squares I flagged in that same post made me read it the other way.
The charts draw the ladder into that crest. The cube’s upper boundary sits near 53,254, the 50% extension of the March 30 to February move I set in #314; the 61.8% is 53,884, the 233 square is 54,289, and the 100% is 55,968. If the parabolic run tops in that 54,289 to 55,968 zone, then the cube window itself is the crest, and what I called a late-August crest may come in as a trough instead.
There’s a timing marker on top of it. A total solar eclipse falls on August 12, 2026, its path of totality arcing over the North Pole and crossing eastern Greenland, western Iceland, and northern Spain; North America sees only a partial. This eclipse belongs to Saros series 126, the same family as the eclipse of August 1, 2008, one Saros cycle (about 18 years) earlier. In 2008 the Dow made a lower high on August 11 at 11,867, turned down the next day, and fell into the March 2009 low. That’s one analog, not a rule, but the Saros link drops the 2026 eclipse right inside my window.1
That’s the reading I’m weighting now: a top in the early-August window, tightest between the 6th and the 9th, while the Dow leads and 1898 holds, then a pullback, and possibly the start of a downturn into late August and on toward October 2026.
This is my preference for now. Cycles take time to turn, and a crest can stretch a week or two past the ideal count. If the run keeps climbing through the window, the corner isn’t the top: the trajectory carries into the next cube and the crest is deferred, and I’ll say so. Time may tell whether the cube marks a turn.
The Saturn 8x1 line still gives me the line that would prove the larger read wrong. A daily close holding above 52,500 through the window keeps the 1898 case alive. A daily close below the rising Saturn 8x1 moving support, near 50,000 to 51,000 into the autumn, would break the larger analysis, and I’ll update the moment it happens. For the crest call itself: a daily close above 55,968 into mid-August says the top is deferred and the parabola has more room.
Each level is a place where the move may pause or turn. Always watch the chart in front of you.
This is my bias for now. Always keep in mind that cycles can contract, extend, or invert, and anomalies can arise. So, be careful out there. No advice.
Remember, cycles can contract, extend, and invert. I may be wrong, of course. Anomalies can occur, fundamentals can shift, so be cautious.
In case you haven’t noticed, I post various charts in the Substack notes every week. You can find them all here. (click on the link)
P.S.: I’ll post the next update when the early-August window resolves, or sooner if the Dow closes back below 52,500. If it tops in the 54,289 to 55,968 crest zone and rolls over, that’s the price level to watch for. Free subscribers get it by email from the day they join.
If you liked this post from @Fiorente2’s Blog, why not restack and share it?
© 2008–2026 Fiorente2.com. All Rights Reserved.
Disclaimer: This analysis is for informational and educational purposes only and should not be considered investment advice. Read our full disclaimer.
Disclosure: From time to time, I may hold positions in the securities mentioned.
Total Solar Eclipse on August 12, 2026 (NASA Science)
Light CPI saved it.
Great read. Thx