
$DJIA - The dip that may only be a ripple
#314 | Short-cycle tides into late August, long-cycle support into the autumn.

Introduction
It’s July 4, 2026, and the United States turns 250. To my American readers, happy Independence Day. A quarter-millennium is a long anniversary, and long anniversaries are the markers I watch, so it’s a fitting day to see where the short and long cycles stand.

In my “2026 Mid-Year Forecast” (#308, June 14) I set a composite path for the second half: a July high, an early-August pullback, a September high near 52,000, and an autumn low. In “The First Checkpoint” (#309, June 20) the Dow had already run to the 52,000 area two and a half months early, so I set 52,500 as the line that would tilt the read to the stronger 1898 year.
On July 2 the Dow closed at 52,900, up 9.34% year-to-date from the January 2 close of 48,382. That’s above 52,500. This is the update I promised the moment the line cleared.
The S&P 500 still hasn’t confirmed. It closed at 7,483 on July 2, below its June 2 high of 7,620. So the Dow keeps making new highs while the S&P holds under its top, and that split is worth carrying through the analysis. It keeps the early-August pullback on the table even as the Dow leads.
Where the analogs stand now
The three years that led the set in “Mid-Year Forecast” ( #308, June 14) still lead it. Re-measured through July 2, 1898 the correlation sits at r 0.81, 1890 at r 0.69, and 1978 at r 0.65, with the top-3 composite at r 0.81. (Here r is the correlation, how closely each old year’s pattern tracks 2026: 1.0 is a perfect match, 0 is none.) 1898 firmed since late June while the others held their rank, so the fit only improved into July.
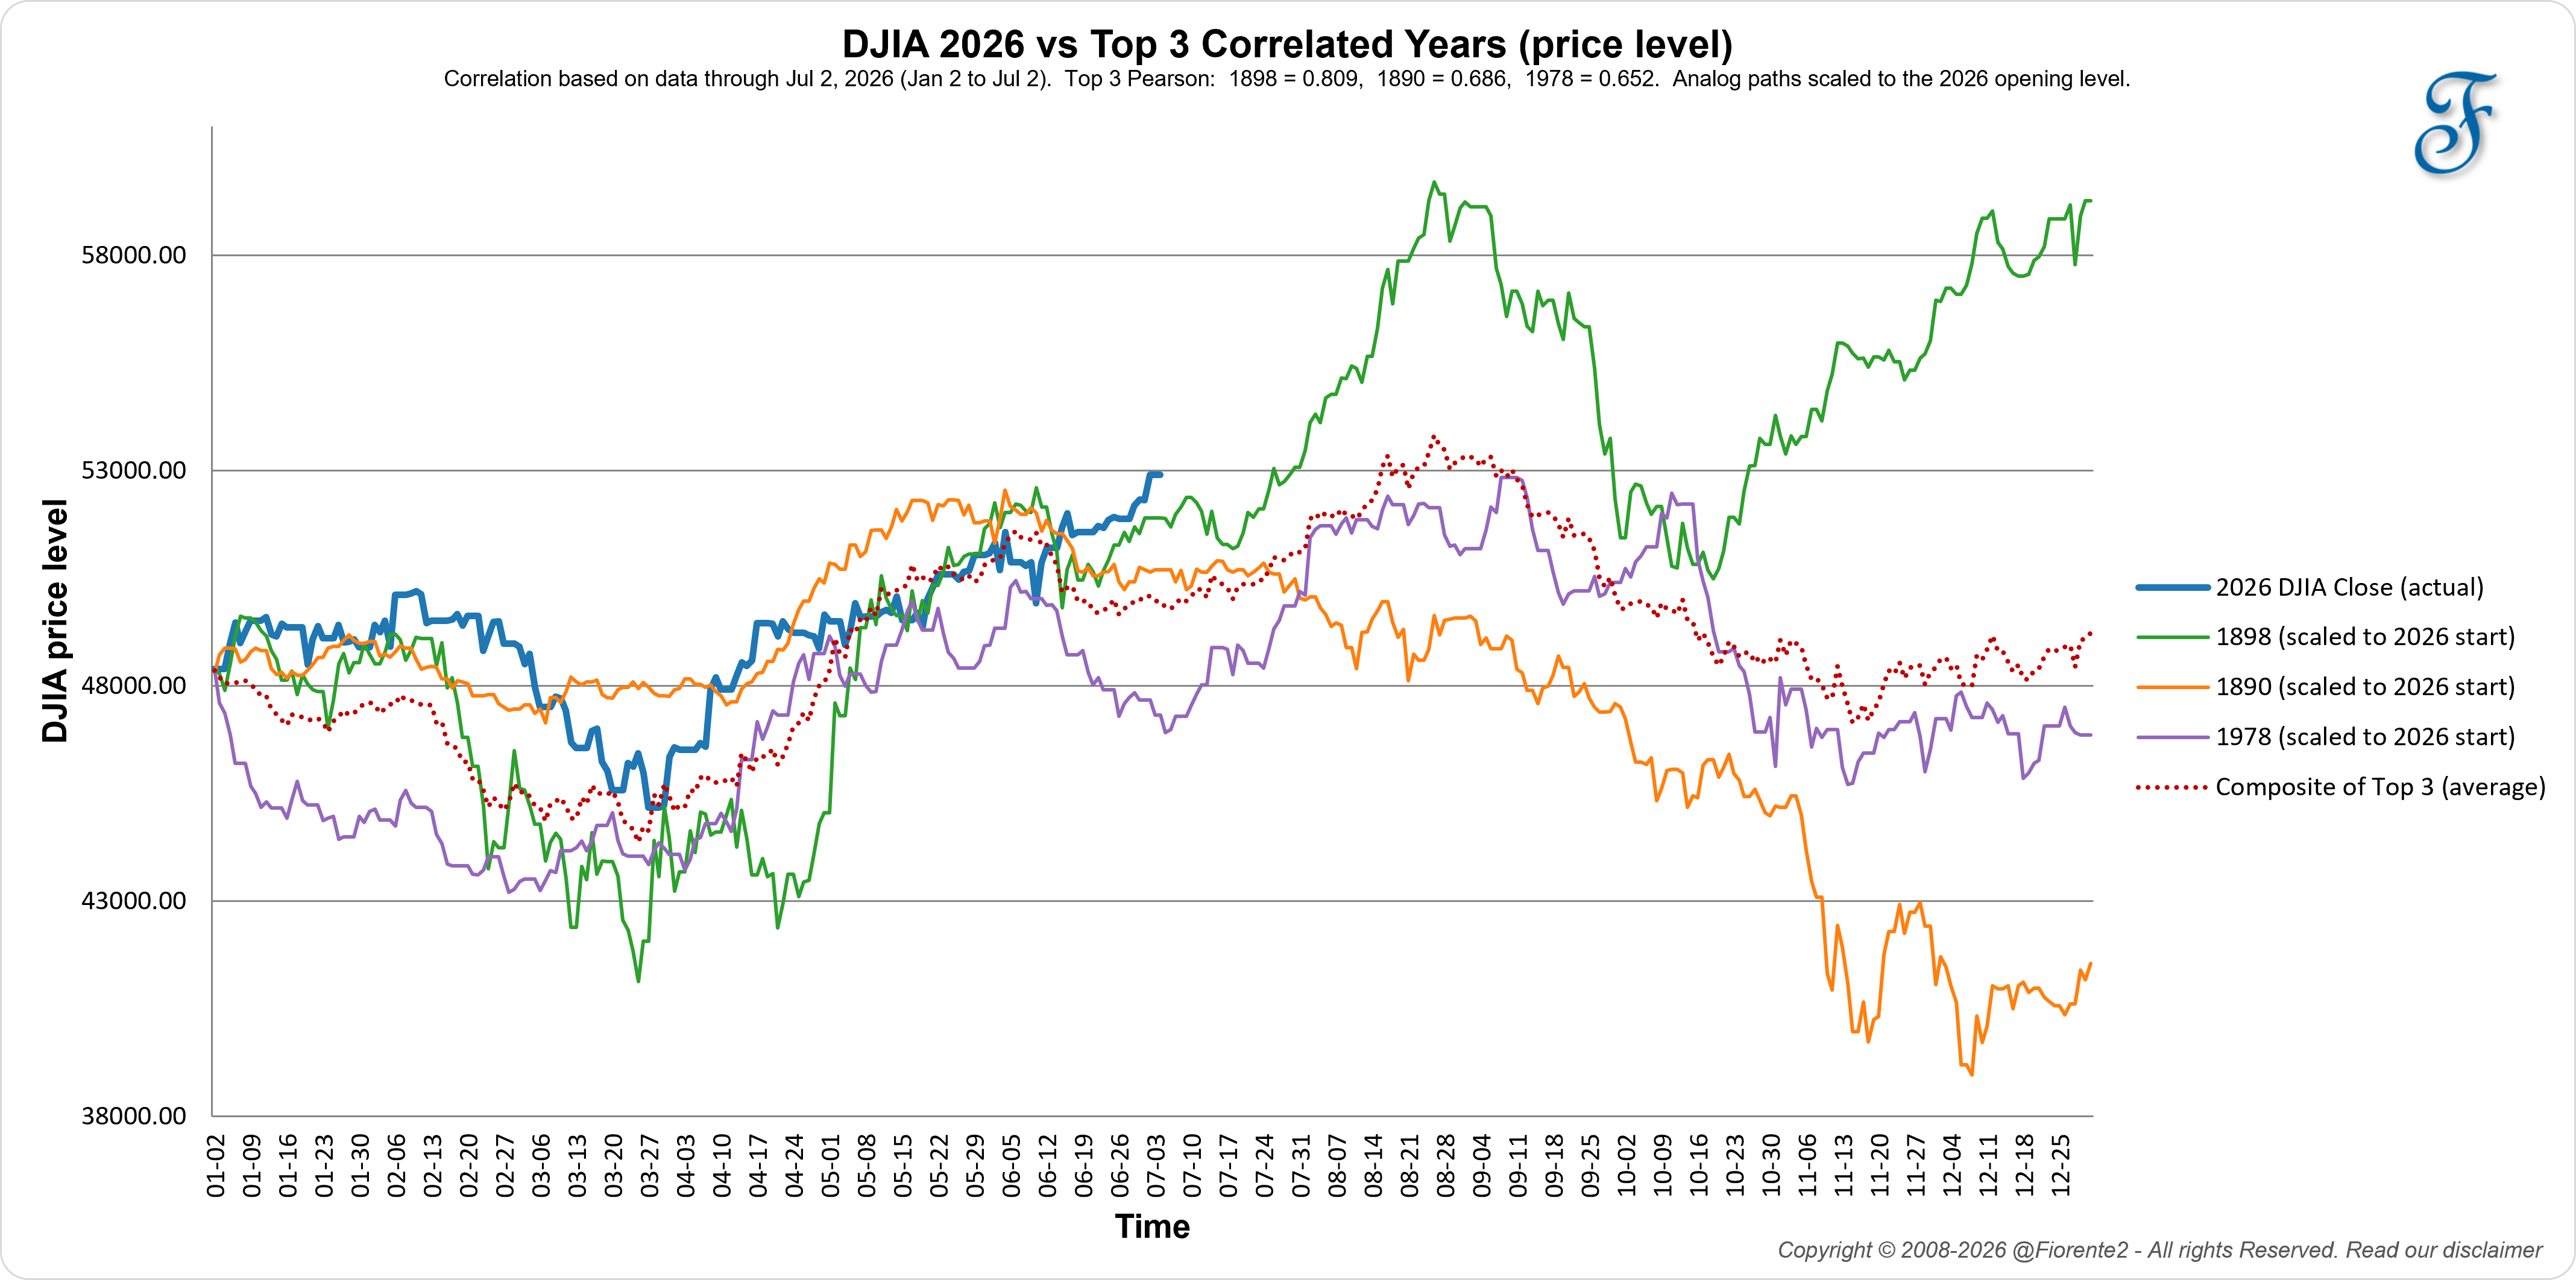
One flag before anyone runs with it. I don’t expect the Dow to reach the 58,000 area the 1898 price overlay would imply. 1898 has the strongest correlation, not a price I’m forecasting.
The 52,500 break matters because of what I said it would mean. When price runs this far ahead of the slower composite path, my bias moves to the stronger year in the set, and that’s 1898.
The dip looks like a minor wave
Economic trends mostly turn on the slow combinations of Jupiter, Saturn and Uranus. The shorter swings come from the faster bodies, the Sun, Moon, Mercury, Venus and Mars, in aspect to those larger planets: smaller cycles inside the larger cycle of the secular trend. A ship on the ocean takes time to turn because of its speed and mass, and the same can be said for the cycles that involve the larger planets.
That’s why I read any dip between now and September as a minor wave, not a trend change. In #309 the Gann cycle-cluster count came in light for July and August and heaviest in September, so the weight in the larger cycles sits later in the year.
The one near-term layer I’d downgrade is the Jupiter-Pluto opposition (geocentric, July 12 to 28, the two planets 180 degrees apart). Pluto is retrograde now, so its pull may be lighter, and I lean on the heliocentric read instead. The opposition has inverted in 5 of the last 7 cycles, and a turn landed inside its two-week window only about 28% of the time (its walk-forward rate in an out-of-sample test).
Weak on its own as a turn signal. It earns its place because in the last 7 cycles the DJIA slid into a dip around the opposition, and the matching high on this record isn’t due before September 2027, more than a year past the July 2026 opposition from a heliocentric perspective.
A tidal-force cluster into late August
My recent research was drawn to the work of the Italian professor Nicola Scafetta and his colleague Antonio Bianchini, who studied how the planets’ tidal pull on the Sun may pace solar activity.1
Their case is that the tides of Venus, Earth, Jupiter and Saturn help explain the 9-to-11-year sunspot cycle. One thing to be clear about: their research is about the Sun and the climate, not the stock market. The financial market step is easy to make. The sunspot cycle has been tied to the economic cycle and its recessions since Jevons wrote about it in the 1870s2, but it is not the only cycle, so I treat that link as a probability, not a rule.
I recreated their tidal model as an index and added Mercury, which is closest to the Sun and drives the shorter swings.
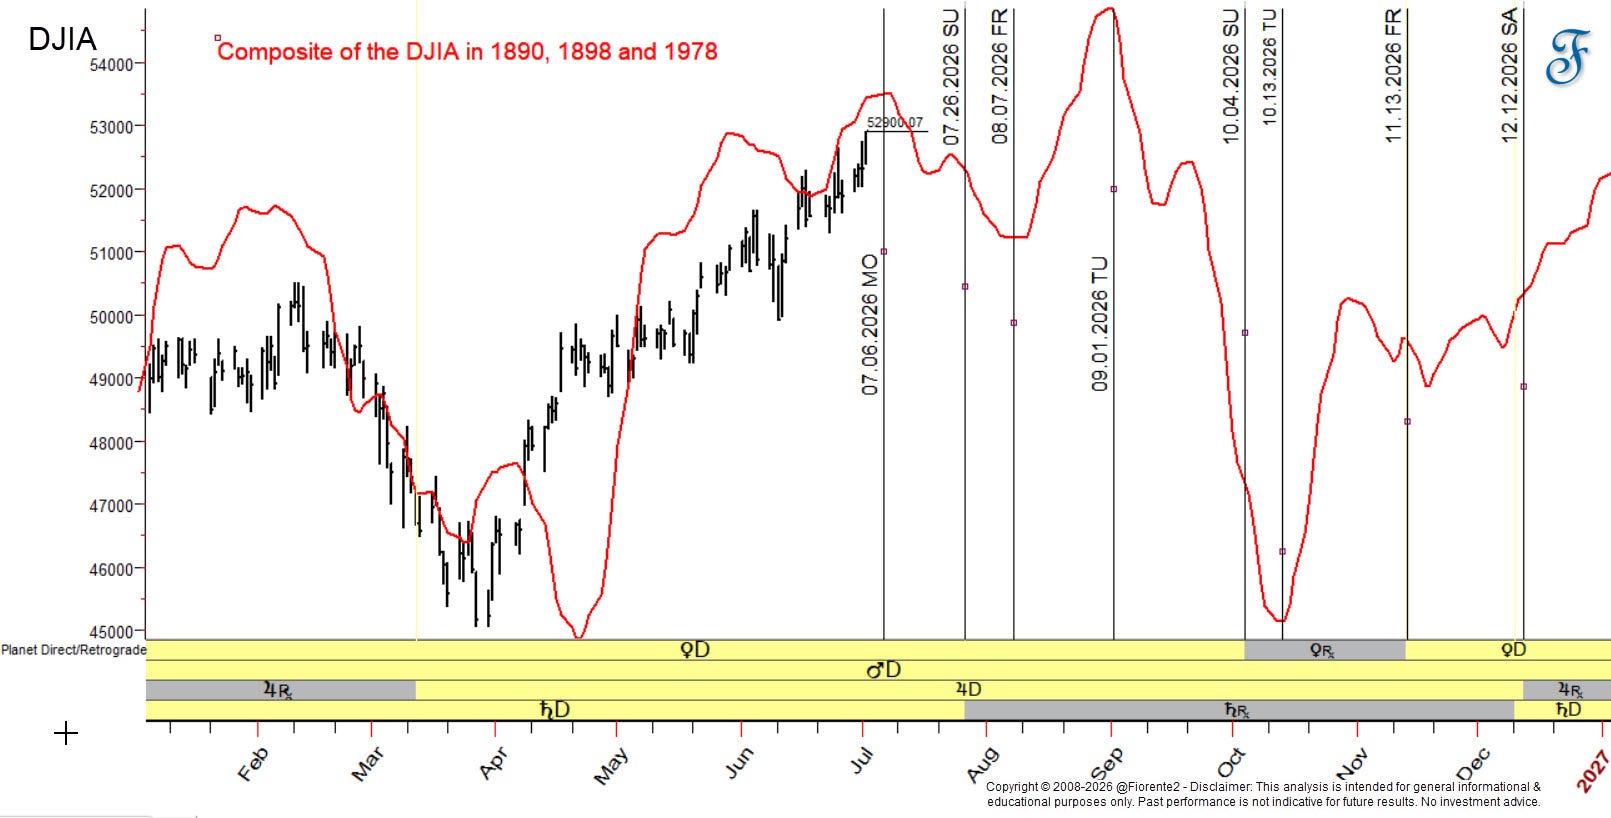
On the chart below Mercury is also the planet doing the aligning in this window: it makes four aspects to Venus, Jupiter and Saturn inside five days in late August. The index built (not shown on the chart) from those angles clusters into late August, close to early September.
The pull may be weak on its own, as Scafetta stresses. It runs stronger on the hard aspects, the conjunction (zero degrees), square (90 degrees) and the opposition (180 degrees), and when several of these fall together the chance of an inflection goes up.
The next square of Mercury and Saturn and the Venus sextile to Mercury (60 degrees) may be the short-term wobble the composite shows in early August. I’m not so sure the dip will run as deep as the composite analog chart 2 shows into early August.
The next confluences
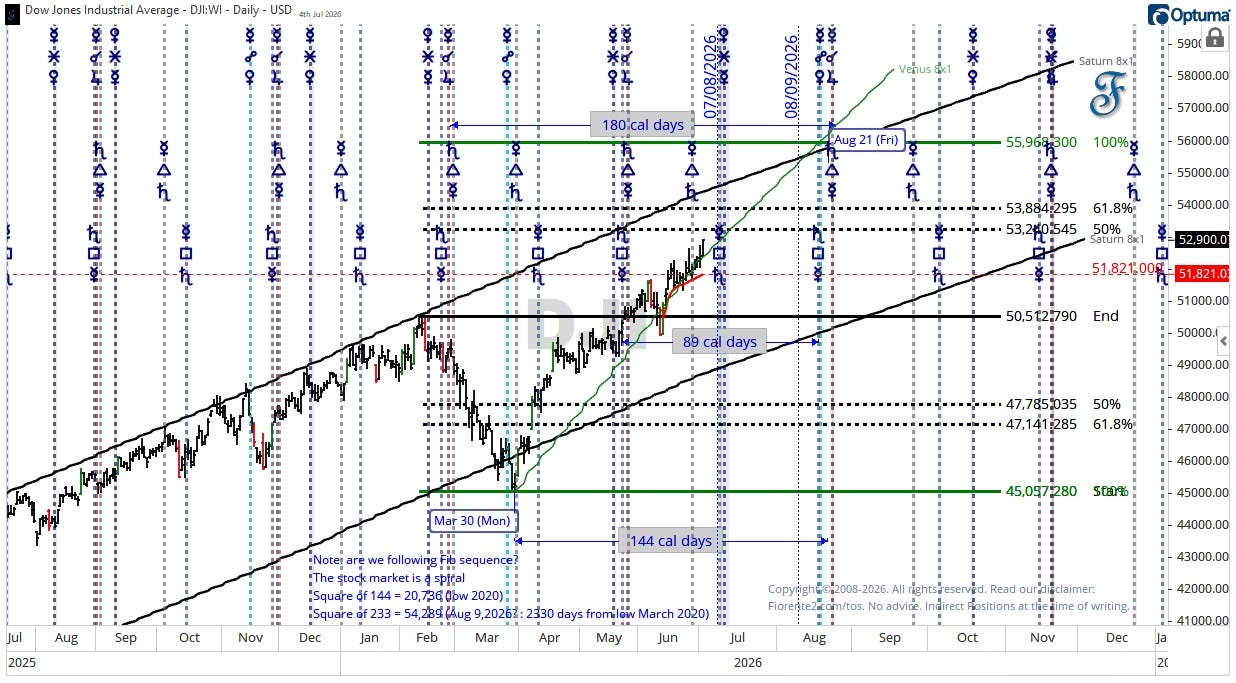
It’s entirely possible the trend follows the Venus 8x1 timing line (a price-and-time line at an 8-to-1 ratio) right into the end of August. By August 21 the market is around 180 calendar days from the Mercury-Jupiter conjunction of February 25, after which the Dow corrected sharply into the March 30 low.
The Mercury-Jupiter conjunction on August 22 sits inside a heliocentric cluster: Mercury-Venus opposition on August 18, Saturn square Mercury on August 17, and Saturn trine Mercury (120 degrees) on August 22. These dates carry the heaviest tidal pull in the window, which is why I’d watch August 21, a Friday, for a crest.
The crest may sit at the 100% Fibonacci extension of the move from the March 30 low at 45,057 to the February high at 50,512: that projects to 55,968, with interim levels at 53,241 (50%) and 53,884 (61.8%). That target sits above the current 52,900 and below the 1898 analog’s 58,000, which I don’t expect.
There’s a Fibonacci rhythm under the same window. The square of 144 is 20,736, the price at the COVID low of March 23, 2020. The square of the next Fibonacci number, 233, is 54,289. And ten times 233 is 2,330 days; counted from that March 23, 2020 low, it lands on August 9, 2026, right inside the crest window. This may be coincidence. But the market moves in a spiral related to the Fibonacci sequence, so I note it.
Here’s the change from my earlier post #308. I no longer carry the October low near 46,200. Chart 3 shows the rising Saturn 8x1 line as moving support, the line that held the March 30, 2026 low and runs from the April 7, 2025 low it originates from. That support climbs into the 50,000 to 51,000 zone by October and November. So if an autumn pullback comes, I’d look for it to find that moving support near 50,000 to 51,000, not the 46,200 I named in June.
The Saturn 8x1 lower timing line gives me the line that would prove this analysis wrong. A daily close that holds above 52,500 through August keeps the 1898 case alive. A daily close below the rising Saturn 8x1 moving support, near 50,000 to 51,000 into the autumn, would break it, and I will update the analysis the moment it happens.
Each level is a place where the move may slow, pause, or turn. Always watch the chart in front of you.
Conclusion
The 52,500 break on July 2 is the change since #309. It brings my analysis to the stronger 1898 analog year and points to any July-to-August dip being a minor wave inside the larger cycles rather than the start of an autumn decline. The tidal-force index, the Venus 8x1 line, and the August 17-to-22 heliocentric cluster all point to a possible crest into late August, near the 55,968 extension, with August 21 the tightest date.
The old October low near 46,200 comes off the calendar. The Saturn 8x1 moving support has held since the April 2025 low, and it now sits far higher, in the 50,000 to 51,000 zone by autumn. The S&P is the caution: until it clears its June 2 high near 7,620, the early-August pullback stays in play.
This is my bias for now. Always keep in mind that cycles can contract, extend, or invert, and anomalies can arise. So, be careful out there. No advice.
Remember, cycles can contract, extend, and invert. I may be wrong, of course. Anomalies can occur, fundamentals can shift, so be cautious.
In case you haven’t noticed, I post various charts in the Substack notes every week. You can find them all here. (click on the link)
P.S.: I’ll post the next update when the August window opens, or sooner if the Dow closes back below 52,500 or the tidal-force cluster turns the market ahead of schedule. Free subscribers get it by email from the day they join.
If you liked this post from @Fiorente2’s Blog, why not restack and share it?
© 2008–2026 Fiorente2.com. All Rights Reserved.
Disclaimer: This analysis is for informational and educational purposes only and should not be considered investment advice. Read our full disclaimer.
Disclosure: From time to time, I may hold positions in the securities mentioned.
Scafetta, N., and Bianchini, A. (2022). The Planetary Theory of Solar Activity Variability: A Review. Frontiers in Astronomy and Space Sciences, 9, 937930.
Jevons, W. S. (1878). Commercial Crises and Sun-Spots. Nature, 19, 33-37. Jevons called it a “rather fanciful hypothesis” himself; background at W. S. Jevons, Wikipedia.