

Introduction
Last week a reader told me the 60-year cycle had gone off-track, and that my changing my read along the way meant tracking it is meaningless. In his view it’s been off-track since 2022. Respectfully, I pushed back and pointed him to my findings on the 60-year cycle in recent posts.
I didn’t disagree with one part of it. This cycle isn’t always the dominant one that tracks the current pattern best. And I’ll admit my bias: I’ve followed it since 2008, the long-term direction has held up well, and the occasional inversions kept resolving back to the 60-year path within a few years.
In recent posts I showed how the cycle behaved into the February high, which came within one day of the 1966 high.
Tracking it day by day isn’t a good idea, so I stopped posting regular updates. I don’t want to leave readers thinking the market always repeats the pattern of 60 years ago. The themes rhyme, and there may be an astronomical reason for that, as I’ve pointed out before.
The 60-year cycle isn’t the only one that matters. You use it in conjunction with others. It’s the top of a cycle stack that runs from gross to subtle, from the long-term cycles down into the smaller ones. Elliott Wave, Hurst, and the Delta Phenomenon all use a cycle stack. So does the method Gann taught.
The analyst’s dilemma
Making an annual forecast is harder than it looks. The hard part is knowing which cycle is dominant for the coming year, and which months inside it carry the highest confluence of timing signals.
Gann put it plainly: ”TIME is the most important factor of all, and not until sufficient time has expired does any big move up or down start. The Time factor will overbalance both Space and Volume.” (Ch. 7, Master Stock Market Course, 1955.)
His method is hierarchical. You start at the top of the cycle stack and work down, and he laid out the process step by step.
The cycle stack
The 60-year Great Cycle sets the structural frame. Gann called it “the greatest and most important cycle of all” and pointed to the 1861–1869 war and panic as structurally similar to 1921–1929, roughly 60 years later. Before anything else, this tells you whether the current era sits inside a major bull regime or a structural bear period.
Inside that, the 20-year cycle is the most important for annual forecasting. Gann built a Master 20-year Forecasting Chart from 1831 to 1935, overlapping each period so the equivalent year in any prior cycle reads directly against the current one.
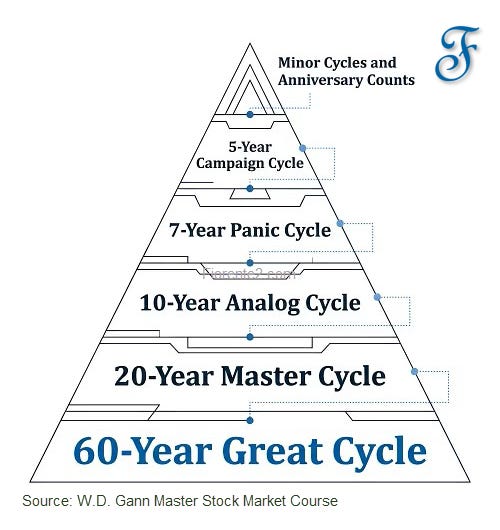
The 10-year cycle is the most directly usable: ”Fluctuations of the same nature occur which produce extreme high or low every 10 years. Stocks come out remarkably close on each even 10-year cycle.” (Ch. 7)
The 30-year horizon isn’t a separate tier so much as a comparison rule built on the 10-year cycle. Gann’s instruction: compare the current year with the record 10, 20, and 30 years back. Where those three agree on a month, that month carries more weight. That’s why the stack diagram shows the 10-year tier rather than a separate 30-year block.
Then come the intermediate cycles: the 7-year panic cycle (84 months), the 5-year campaign structure, and inside those the minor 3-year and 2-year rhythms. Gann’s rule on campaign length is that bull or bear campaigns rarely run past 3 to 3½ years without a counter-move. A market 37 or 40 months into an uninterrupted advance is extended by that standard, and that fact belongs in any annual forecast independent of what the longer cycles say.
The minor cycles add resolution inside the frame. A 12-, 24-, or 36-month anniversary count from a recent pivot, landing near a window the longer cycles already flagged, upgrades that window. In isolation, low weight. Clustered with a long-cycle window and a seasonal date, a good deal more
The year-digit
Running parallel to the cycle stack is the decade pattern. Gann assigned a character to each year by its ending digit, drawn from how the decade tended to behave in his record. He marked year 5 as a strong bull year, year 7 as structurally weak, and year 9 as the strongest, with campaigns often culminating September through November.
It’s a rough tendency, and the major cycles modify it. But it gives you a base expectation before any other calculation, and when the decade digit and the 60-year analog agree on character, that character carries more weight.
The seasonal overlay
Once the cycle positions are set, Gann adds the seasonal structure. He divides the year by the four seasons and their midpoints rather than by calendar months, which produces eight key dates.
Cardinal Cross: March 21, June 22, September 23, December 22
Fixed Cross: February 5, May 6, August 8, November 8
These are structural triggers. Their weight comes from combining with the cycle stack: when a seasonal date and a multi-cycle anniversary land in the same two-week window, that window carries elevated probability of a trend change. In Gann’s record, August 8 and September 23 carry the most weight for major turning points.
Gann also flagged the first week of January and the first week of July as seasonal pivots 180 degrees apart: ”Many times when stocks make low in the early part of January, this low will not be broken until the following July or August.” (Ch. 7, Ch. 10A) These two windows often set the annual range.
How the assembly works
The method is probabilistic. Gann’s own 1936 forecast, the worked example in Chapter 11A, stacks four analog years (1876, 1896, 1916, and the decade-6 precedents), then checks time-distance counts from the 1932 bottom. Where multiple analogs and projections cluster in the same month, that month becomes the watch window. He was direct about the limits: ”This is merely a general outline that I am giving without completing all of my calculations and making up the Annual Forecast in detail.” (Ch. 7)
One analog pointing to a month carries little weight. Three analogs plus a seasonal date in the same two-week window is a different matter. Add a minor-cycle anniversary or a stress-month count in that same zone, and you’ve got a window worth watching closely.
Where analogs conflict and point to different months inside the same broad window, both scenarios stay in the forecast. Confirmation comes from the chart, not the calendar.
What it gives you
The annual forecast builds the frame. Gann’s checklist in Chapter 7 is explicit about what that means: it narrows the year to a handful of watch windows with elevated probability of a turning point. Weekly and daily work then confirms whether a turn is actually happening.
Two windows already stand out for the back half of 2026 on the seasonal layer alone: August 8 and September 23, the two dates that carry the most weight in Gann’s record. Whether either becomes a real turning point depends on what the cycle stack and the analogs say once I run them. That’s the mid-year update.
In the next post I’ll walk that update stack by stack, and show what the method points to for the rest of 2026.
This is my bias on method for now: I weight the whole stack over any single cycle. No advice.
Remember, cycles can contract, extend, and invert. I may be wrong, of course. Anomalies can occur, fundamentals can shift, so be cautious.
In case you haven’t noticed, I post various charts in the Substack notes every week. You can find them all here. (click on the link)
P.S.: Occasionally, I share new analyses exclusively for free subscribers. Subscribing gives you email updates on these posts, plus extra insights and deeper research from the time you join onward; past analyses are not included.
If you liked this post from @Fiorente2’s Blog, why not restack and share it?
© 2008–2026 Fiorente2.com. All Rights Reserved.
Disclaimer: This analysis is for informational and educational purposes only and should not be considered investment advice. Read our full disclaimer.
Disclosure: From time to time, I may hold positions in the securities mentioned.