
My Banker Called Me Nuts
#299 An update on the DJIA following major and minor cycles

Introduction
My banker called me nuts at the end of last year when I pulled out of many positions I had held over the past few years. I explained that the 2026 forecast based on the 60-year cycle was the main reason for pulling out and preserving capital for better times.
I have been following the 60-year cycle for over 18 years and was convinced this cycle would follow the previous pattern again. I may be wrong, of course, as this cycle can invert. So far, I have no regrets. I pulled out some profits. BTW: I still have a considerable amount invested and am always looking for new opportunities.
First, let us revisit the 60- and 4-year cycle updates for the DJIA. I have updated the charts and commentary I used over the past few weeks,
DJIA - The 60-year Cycle & Planetary Time Clusters
New readers may want to read my previous post first. The DJIA is continuing on its course like clockwork, following the 4-year and 60-year cycles.
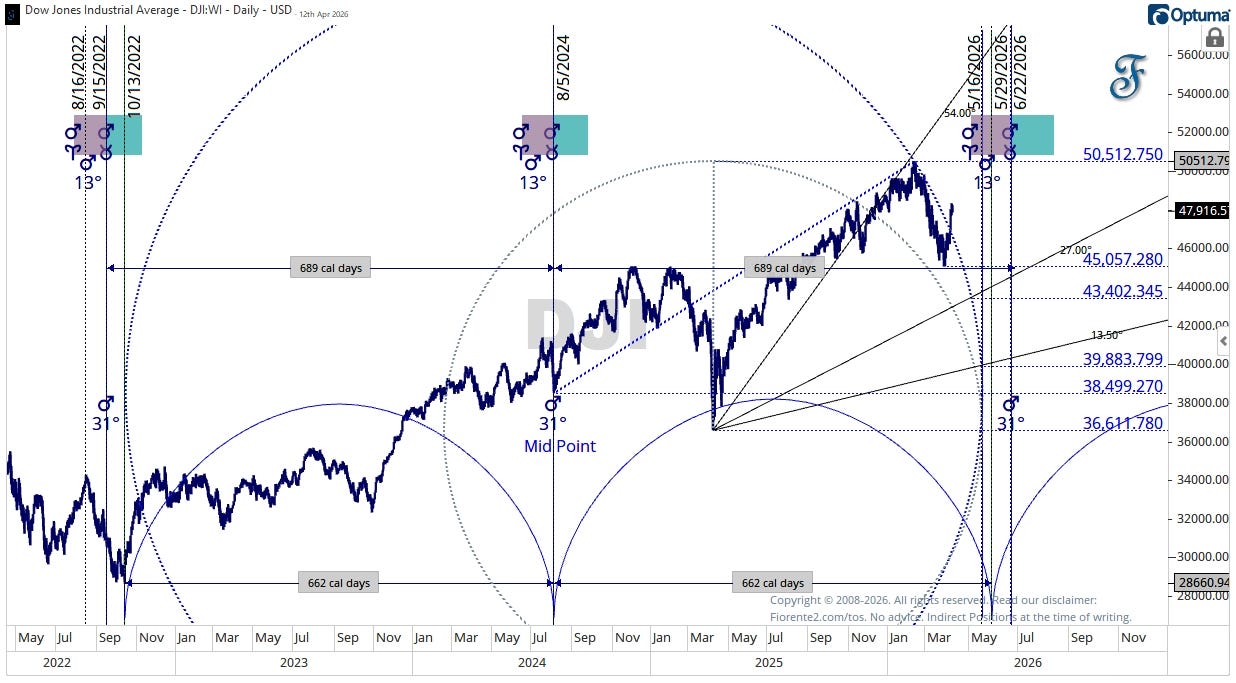
In the updated chart below, based on last week’s chart, I have plotted the cumulative hard aspects (0, 90, 180 degrees) of planetary transits and included planetary geometries. This illustrates the Time Cycle Clusters at the bottom of the chart, where the highest volatility and market activity are expected. I have added a green overlay of a 60-year cycle.
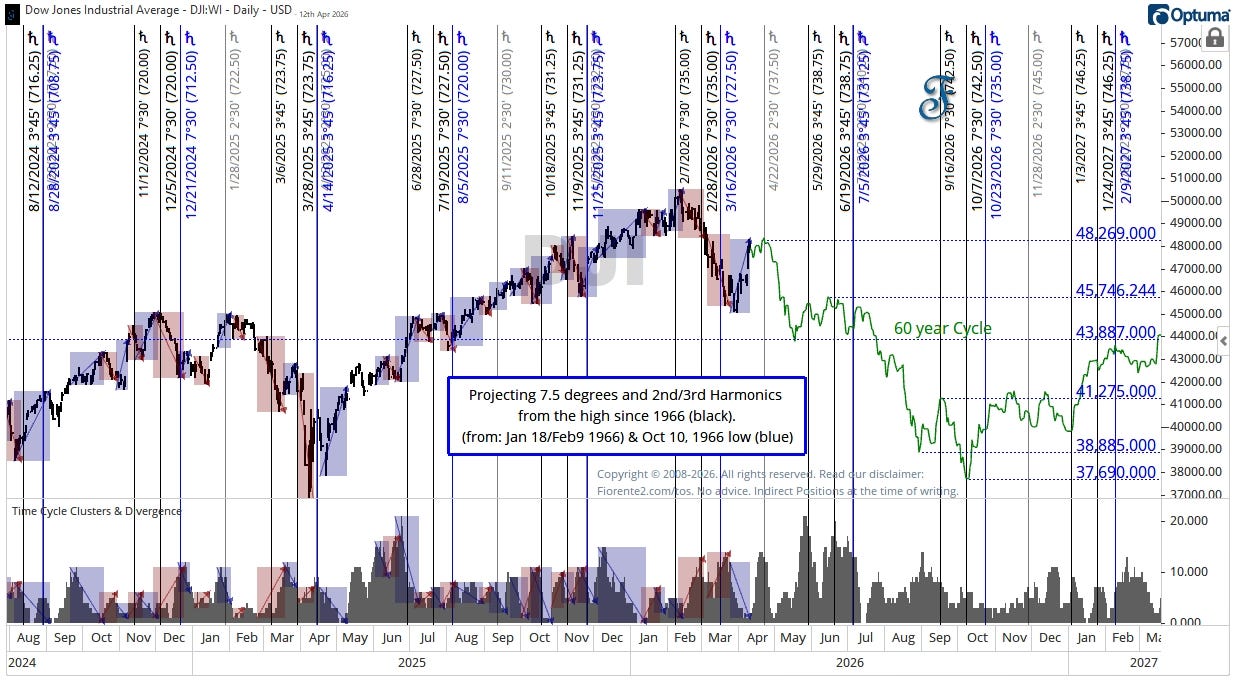
The 60-year cycle forecast has been updated from April 10th, 2026, onward. So far, the DJIA continues to follow the same pattern as in 1966. Even after 60 years, there is an interesting similarity between the 1966 and 2026 inflection points.
👉Although many respected analysts may argue that the worst is over and that there is little evidence that past cycle patterns will recur. So far, I differ in my opinion when looking at the charts for 1966 and 2026.
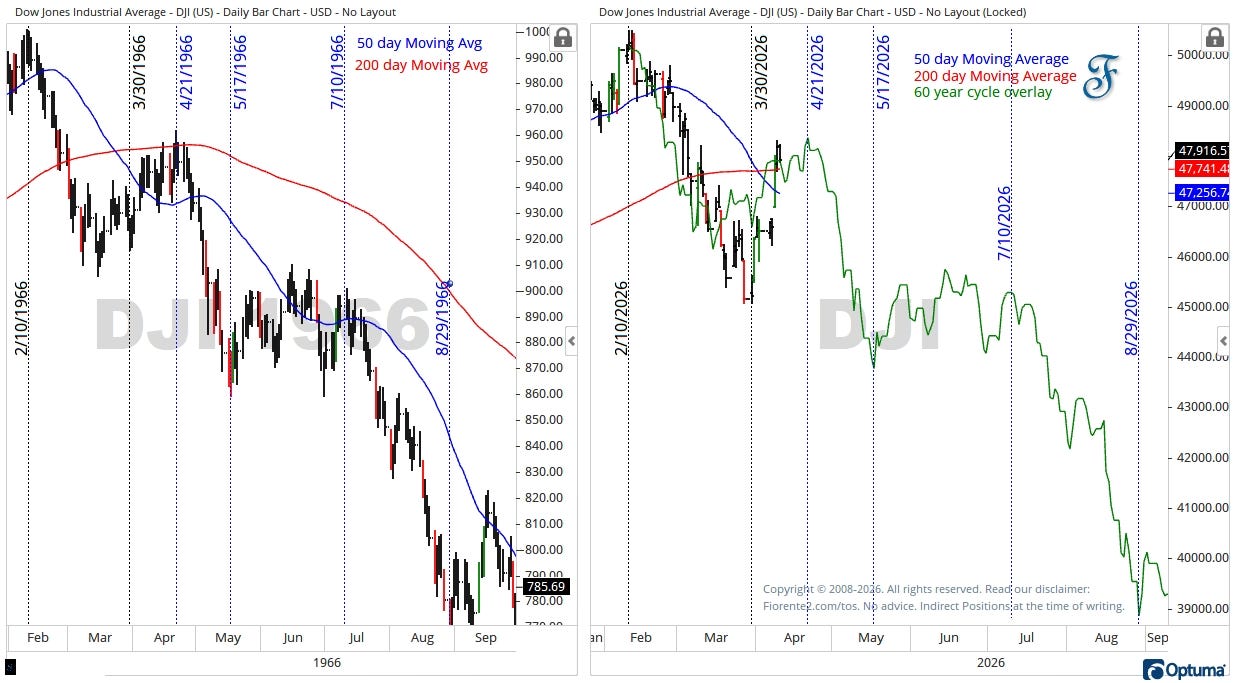
As you can see in the chart above, even the 50- and 200-day averages in both years show remarkable similarities. Note that I overlaid the 60-year cycle pattern without adjusting it for today’s volatility. April 21st is the next important inflection point to watch.
👉 Of course, from time to time, this cycle can invert for a couple of months, as we have seen before. Always watch the chart in front of you.
DJIA - 4-year Cycle
The chart I showed you earlier shows the long-term trend from March 2020 onward. The mid-March low was similar in price and timing to the one from 4 years ago. I have plotted the 4-year analog in dotted black on the chart to remind us that what happened 4 years ago may happen again.
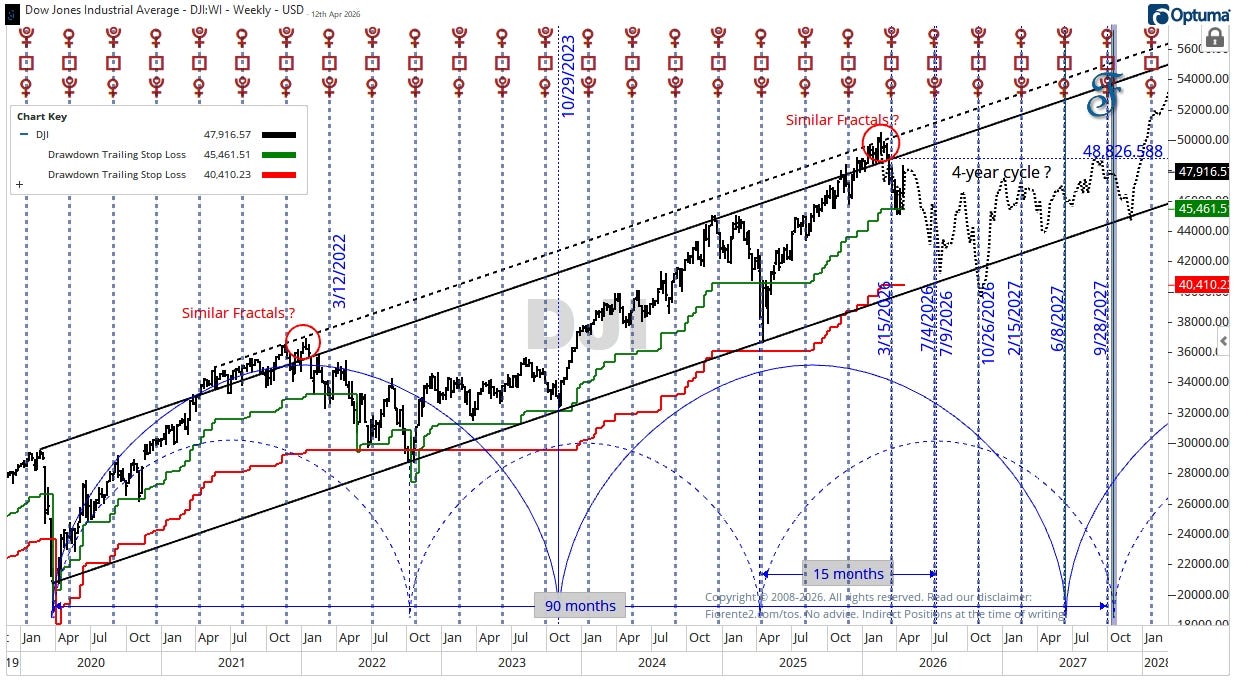
The DJIA recently found support at a 10% decline from its February 2026 peak. If the downtrend continues and falls below this level (shown in green on the chart), we may see a decline of about 20% from the peak, which aligns with the lower trend channel line.
DJIA - Shorter-term forecast
In my last post, I explained the importance of a cycle to forecast the next inflection point using a circle around a key swing wave. New readers may want to re-read this part first.
In the chart below, I have highlighted in blue the circle around the first impulsive wave from the crest, which started on February 12th and ended on February 20th, 2026. You can see that the radius of the circle is the move in price, which can be expressed in time or seen as the duration of the cycle.
Note: This may continue to work for some time when you lock the price/time ratio on the chart.
👉 Providing the harmonic relationship between previous vectors will continue in the future, the next inflection points may be found at the right edge of each circle (cycle). This aligns with the 60-year cycle forecast.
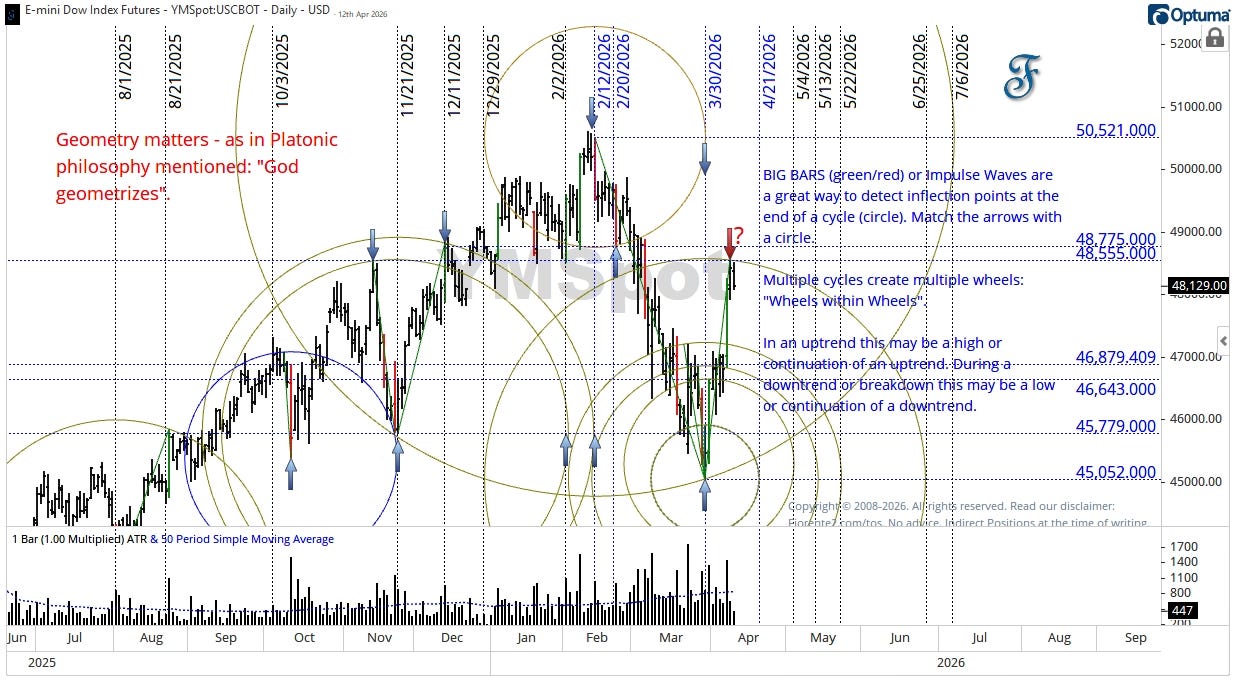
Note that the cycle at the top of the chart is based on the seed cycle in blue (midpoint at 10/3/2025) that locked the chart’s price/time ratio. This price-to-time ratio, to which the chart is set, may work for quite some time.
Hence, based on this analysis, the next trend change could occur as early as mid-April or as late as mid-May 2026, before we can see a clear direction the market will take. Perhaps, in Elliott Wave terms, we are now in an Elliott Wave 2 of some degree.
Perhaps this may follow the Mars Helio Position through the Zodiac.
Mars Helio Cycle
The Mars Helio Cycle is an almost 689-day calendar cycle, with its most recent low occurring in August 2024. This marks the midpoint of a nearly two-year cycle that began when Mars entered Taurus at 31 degrees.
This cycle is connected to the low in October 2022, which occurred at approximately the same Mars degrees, as Mars entered Taurus in late September to early October 2022.
If this cycle repeats, we can expect, with some ups and downs, a rebound into mid-May 2026, followed by a decline toward June 2026, when Mars reenters Taurus. This cycle can sometimes invert.
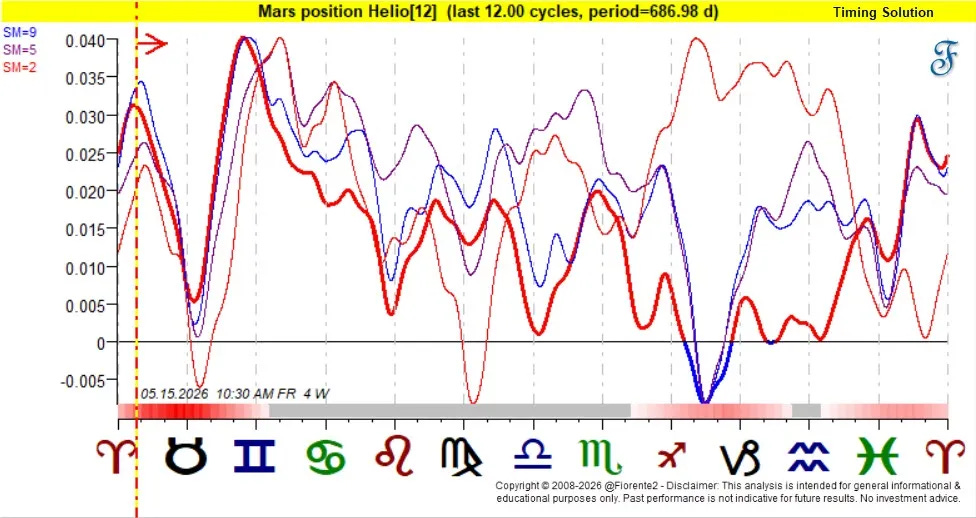
There is no way to know whether the Mars Helio cycle will invert this time. The first chart (DJIA Daily Chart - Mars Helio Cycle) suggests this cycle may invert for now, in line with the 60-year cycle. However, in the last 12 occurrences, Mars’s average zodiac path has remained consistent, as shown in the chart above.
👉 Hence, it is possible we may enter a period in which the 60-year cycle can invert. A possible second crest?
Conclusion
So far, the US indices appear to follow important 60-year and 4-year cycle patterns. The geometric analysis suggests we may have reached a potential inflection point on March 30, 2026, which aligns with these time cycles. The next inflection point, using the geometric method of circles around recent swings, is around April 21st, 2026. This may be only a short-term rebound within a longer-term downtrend.
However, it seems that the Mars Helio Cycle, an almost 2-year cycle, also corresponds to these cycles when using the circle method. From time to time, this cycle may cause an inversion of the longer-term cycles if the Mars Helio Cycle repeats, as we have seen in the last 12 instances.
We may then expect, with some fluctuations, a possible rebound into mid-May 2026, followed by a decline toward June 2026 when Mars enters Taurus again. This may result in a short rebound from March 30th, 2026, into mid-May 2026. There is about a 60% chance the US Indices will follow this cycle. The consequence will be that the 60- and 4-year cycles may invert for some time.
Hence, there are two possible scenarios, and we will have to wait until the 3rd or 4th week of April to determine which will prevail.
The financial markets are highly volatile right now, and this may continue for a while, as there is no clear path to the end of the war in Iran. At times like this, I stay out of the markets and will see what happens. When volatility subsides, we may foresee some good opportunities to take new positions.
Remember, cycles may contract or extend, and no forecast is certain. This analysis is for educational purposes—always do your own research and manage risk accordingly.
In case you haven’t noticed, I post various charts in the Substack notes every week. You can find them all here. (click on the link)
P.S.: Occasionally, I share new analyses exclusively for free subscribers. Subscribing gives you email updates on these posts, plus extra insights and deeper research from the time you join onward; past analyses are not included.
If you liked this post from @Fiorente2’s Blog, why not restack and share it?
© 2008–2026 Fiorente2.com. All Rights Reserved.
Disclaimer: This analysis is for informational and educational purposes only and should not be considered investment advice. Read our full disclaimer.
Disclosure: From time to time, I may hold positions in the securities mentioned.
The market just hit ATH today,will this invert or change 60cycle?or how should i know if the cycle is inverted somehow?cuz ATH means the trend has been reversed. Does it mean this is the end retrace,and no more lower lows?