

Introduction
"Politicians are like tigers." (S.S.S.) In my experience they do anything to stay in power.
I heard this from a wise man many years ago, during one of his lectures. He was being gentle, actually. His full quote was: “Politicians are like tigers; the essential difference is that tigers aren’t always ferocious while politicians are.”
Politics and Sentiment Define the Direction in 2026
The examples write themselves. Tariff increases in 1965/1966. Vietnam. Ukraine. Now Iran. Whether it is the politics from East or West, North or South, it’s all the same.
Leaders do what they need to do to stay in power, and the people follow, bound by what the wise man in the lecture described this way:
“A nation is neither political nor a linguistic unit. A nation is the manifestation of a sentiment common to nationals.” S.S.S.
That sentiment is the key. It’s what keeps a nation behind its leaders, right up until the moment it doesn’t.
In 2026, the US market is living this out in real time. One day a ceasefire is announced. The next, the Strait of Hormuz is closed. The day after, bombing resumes. Market sentiment follows the people, and the people follow the tiger.
Hence the market goes hither and thither, with no clear direction.
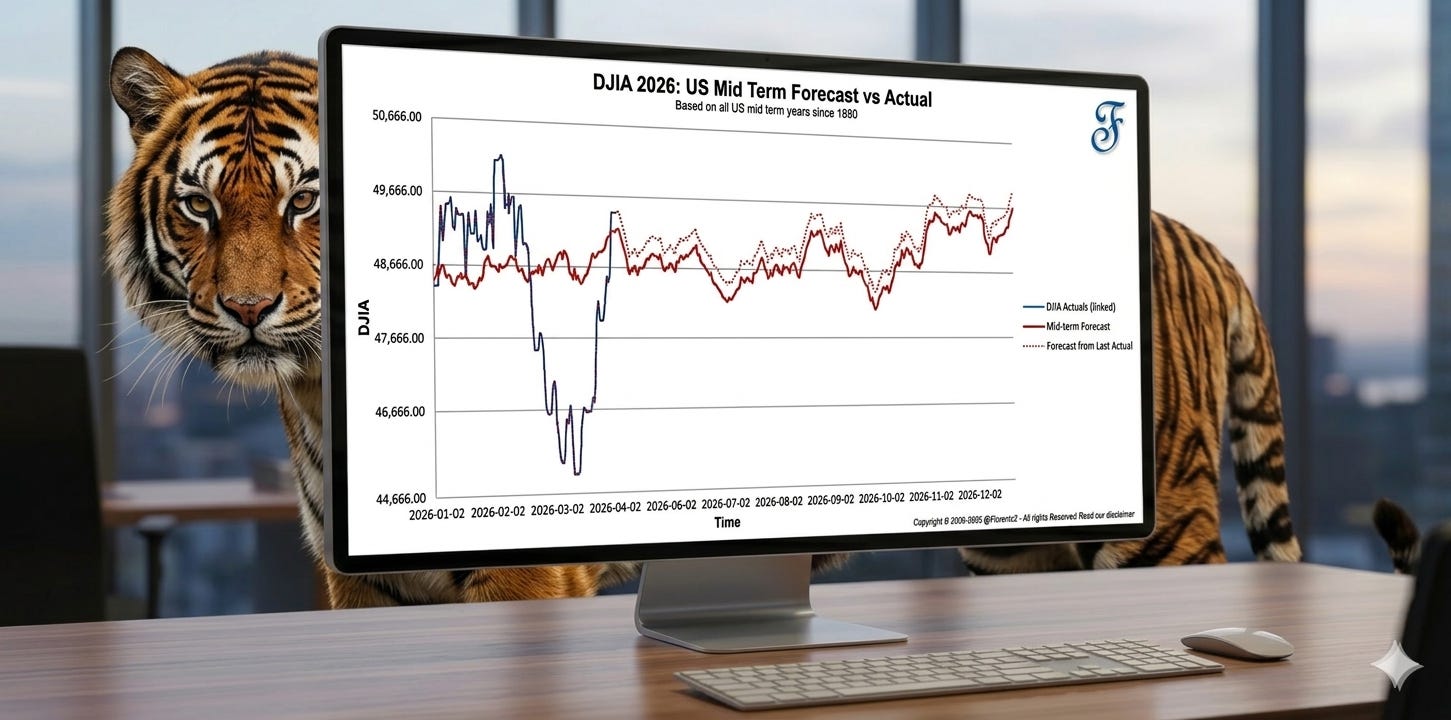
Which is exactly what midterm years tend to do, and what you see in the above chart on the computer screen.
(BTW: I’ve put a chart on a computer screen, with a tiger watching behind it. It felt appropriate.)
The midterm year
2026 is a US Midterm election year, the second year of the presidential term. I’ve gathered 35 midterm years of DJIA data to put what we’re seeing into context.
The chart below shows the average DJIA performance across those 35 midterm years, overlaid on how 2026 has performed so far.
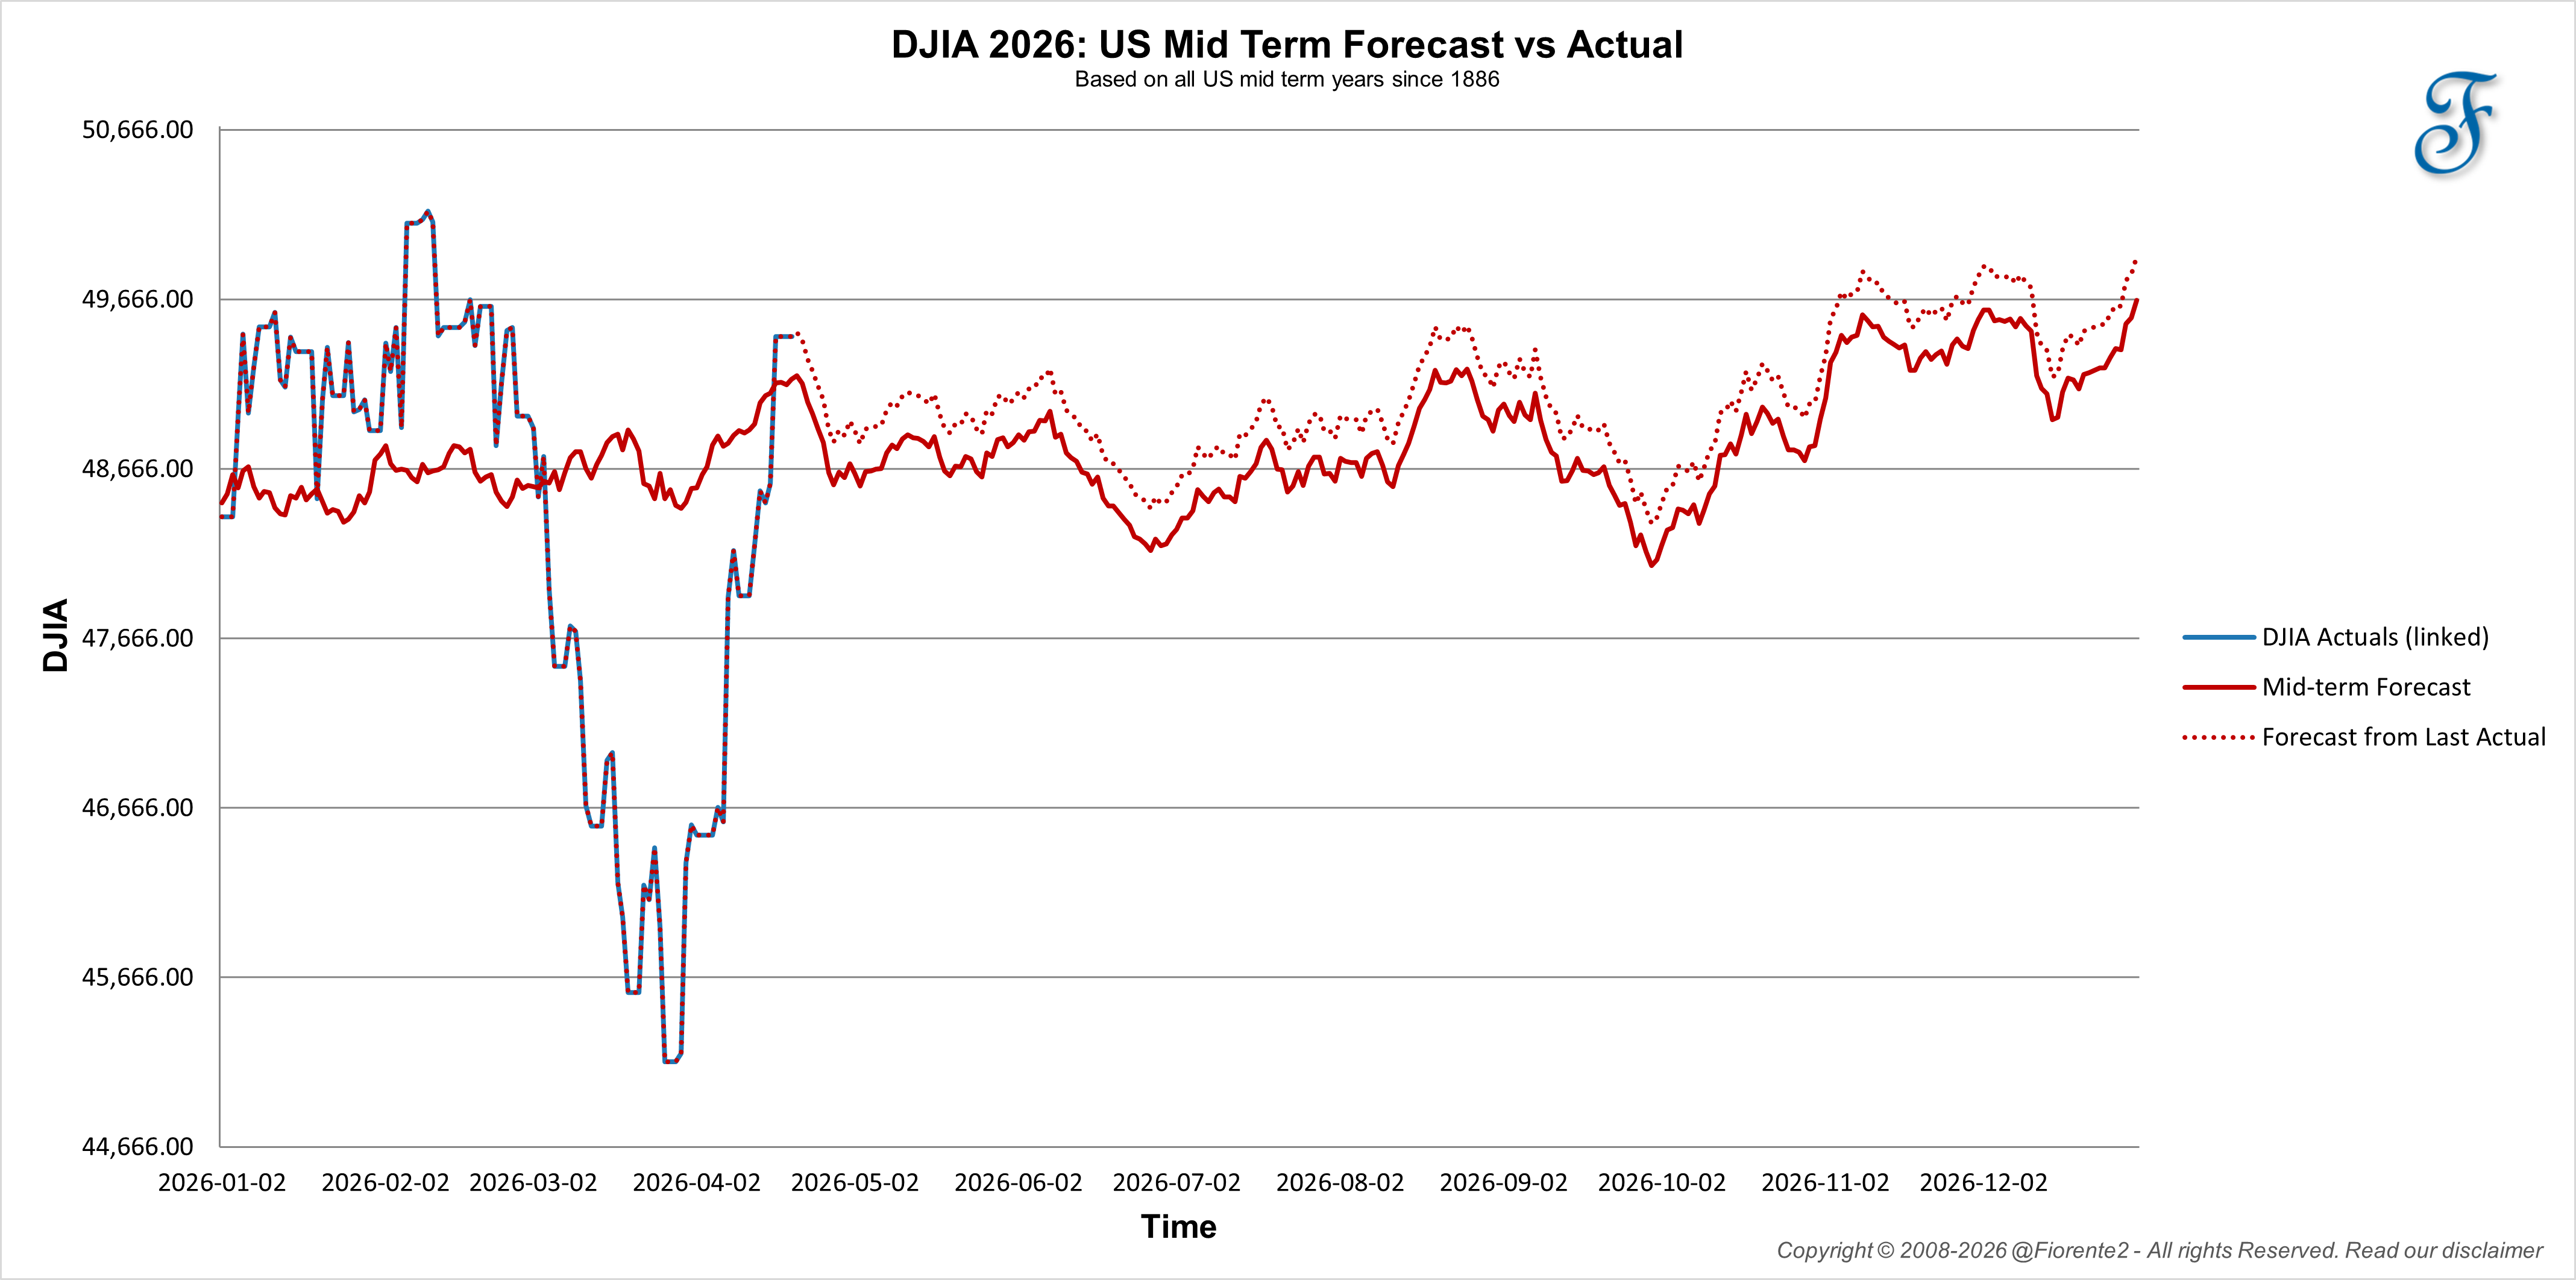
The average midterm year ends roughly +/- 2% from where it started. That sounds tame. The range of outcomes around that average is anything but.
The spread: -25% to +45%
When you plot all 35 midterm years individually, the picture gets more interesting.
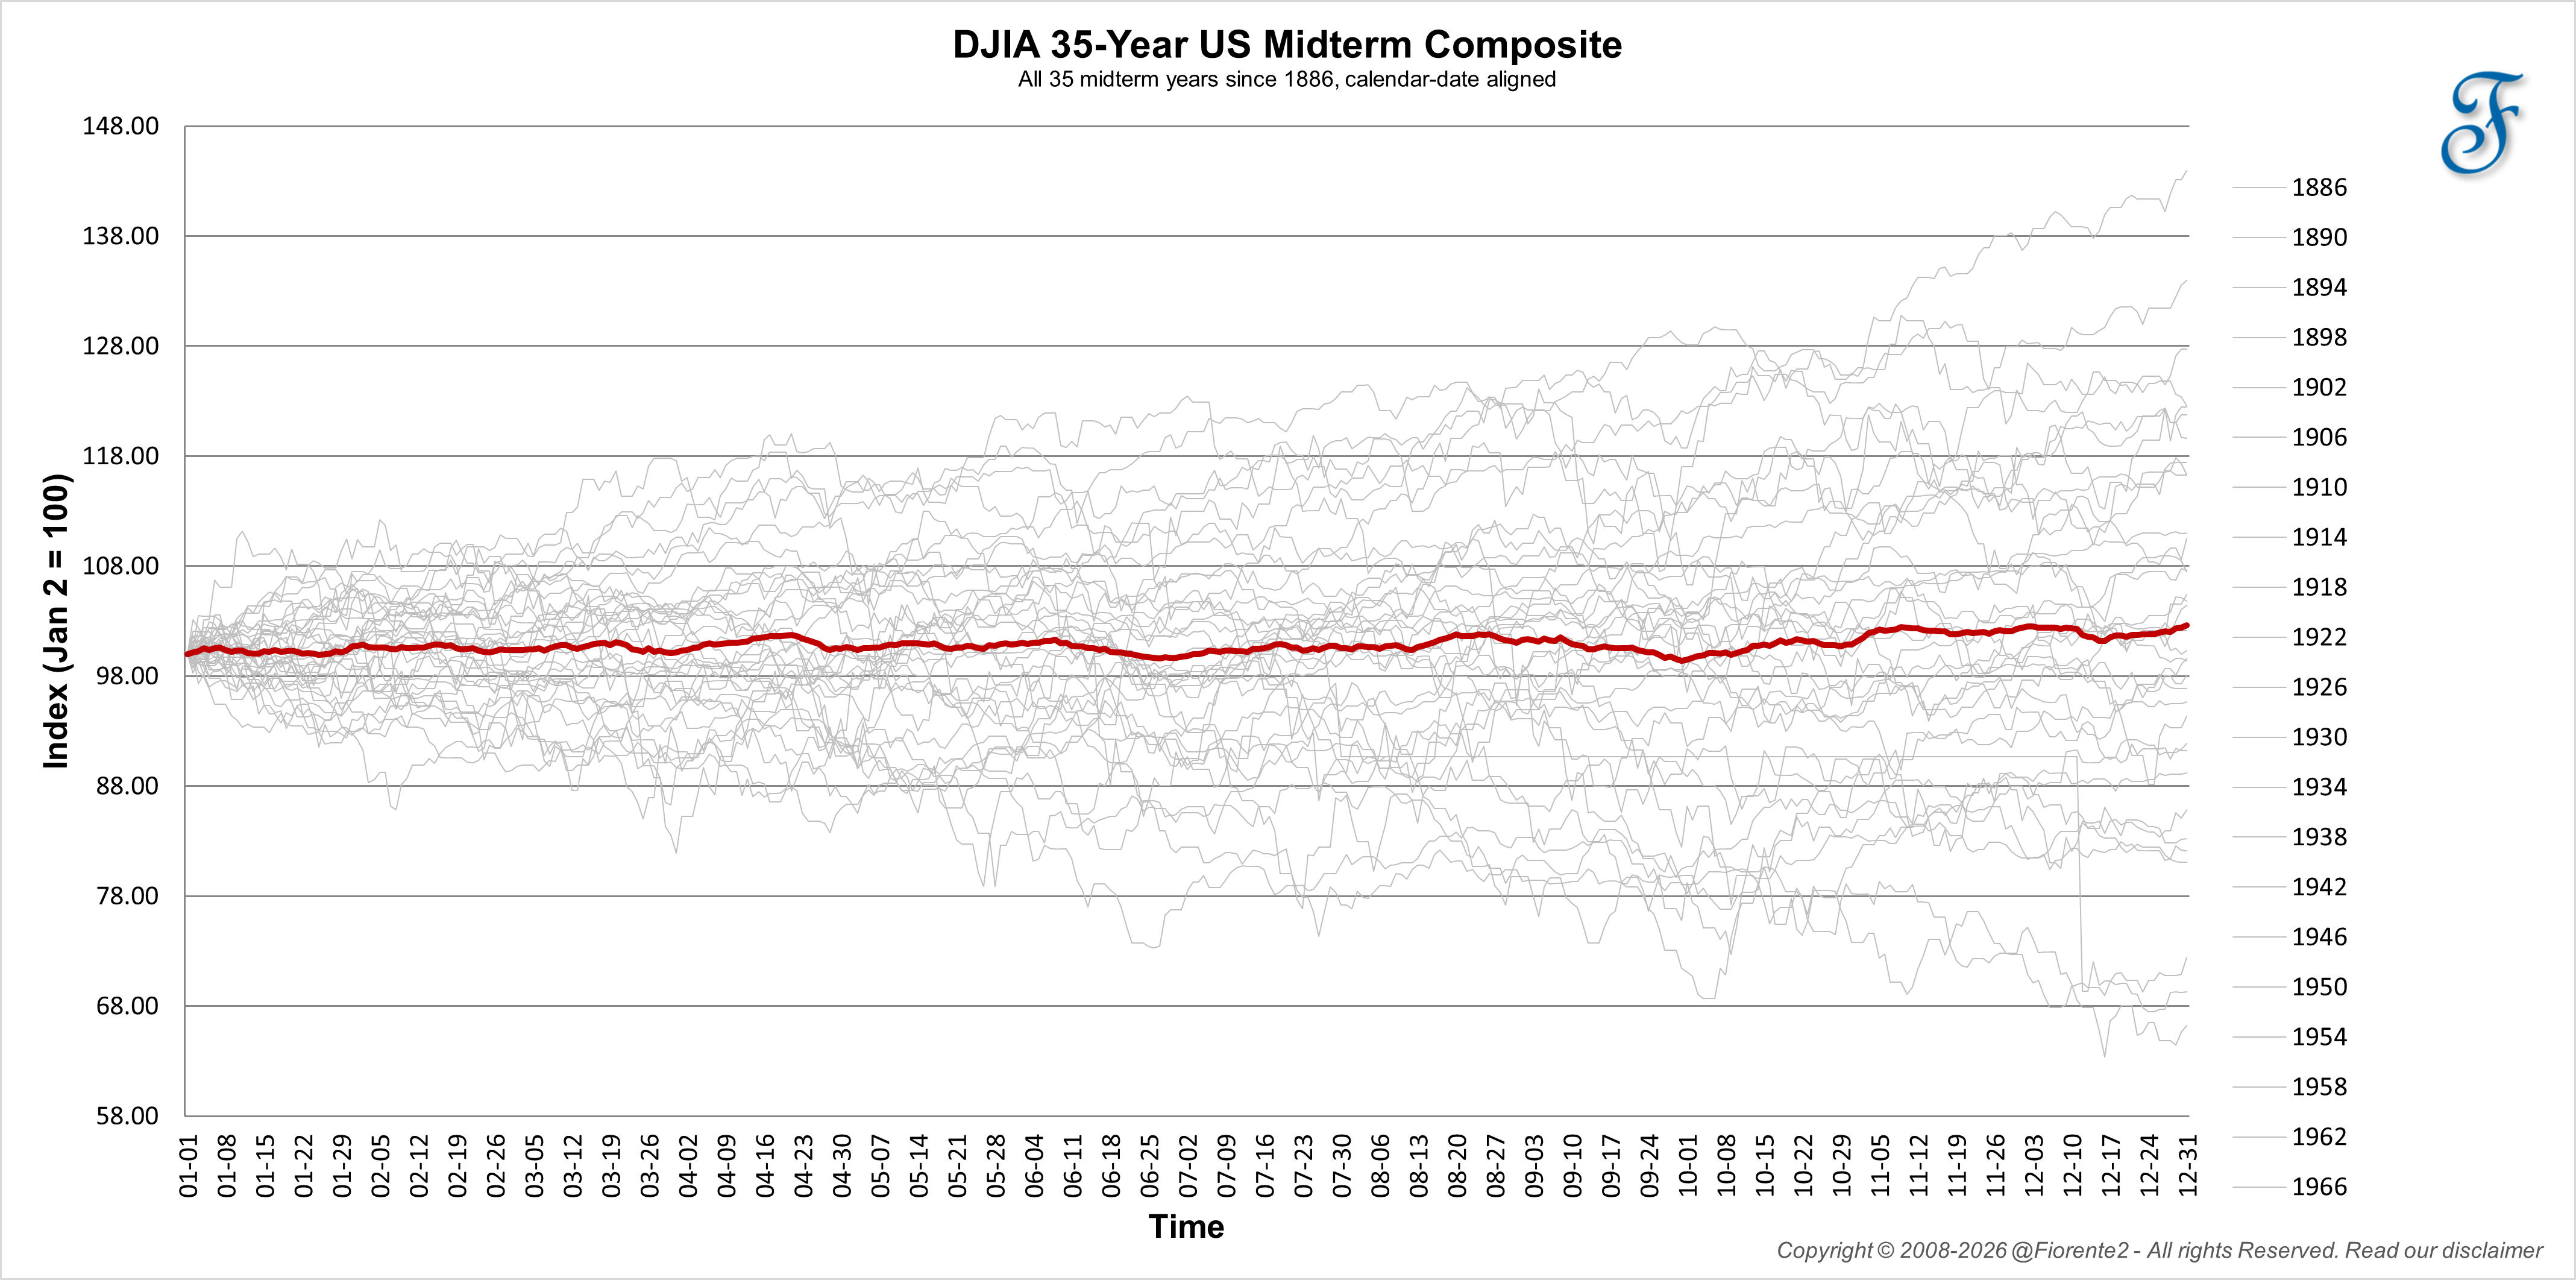
In difficult midterm years, the market has fallen as much as 25%, as it did in 1966. In prosperous ones, it ended the year up 45%. The average of +/- 2% is probably the best most people can hope for right now, given the current environment.
This is what makes forecasting a midterm year genuinely hard. The spread of outcomes is enormous. And whether you end up closer to 1966 or to one of the better years depends largely on the behavior of the tiger.
The Composite Analyzer: top 3 analogs
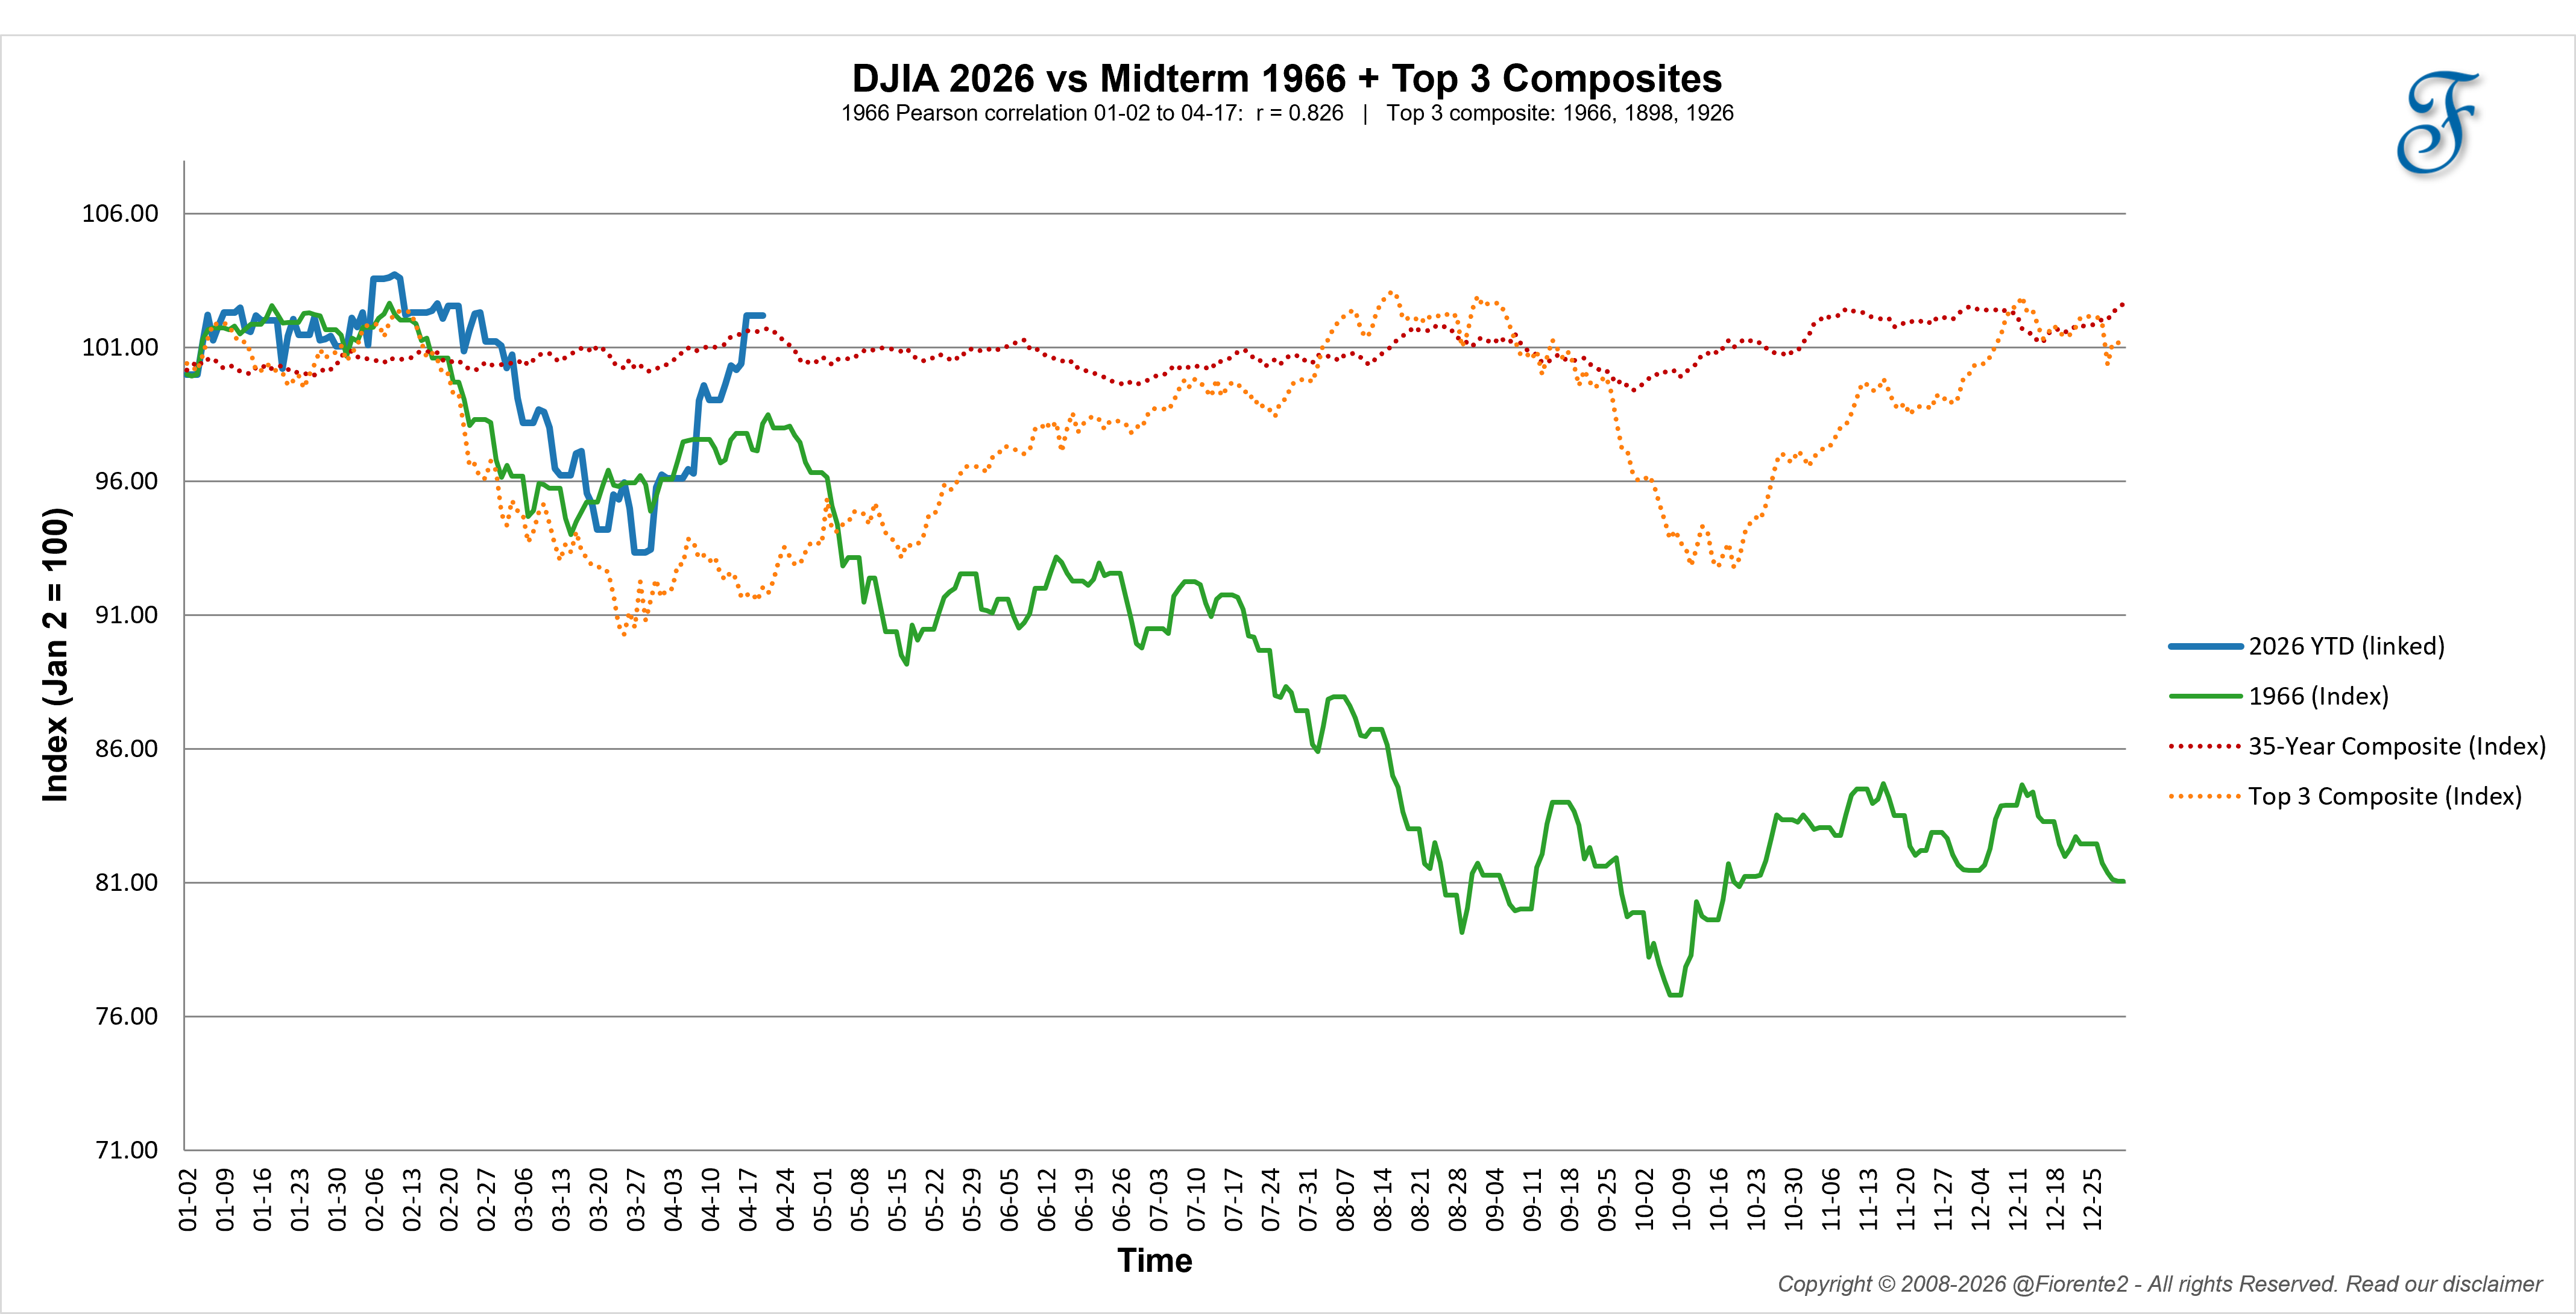
To get a sharper view, I’ve built a tool that identifies the top 3 midterm years with the highest correlation to 2026 DJIA performance, from January through last week. It then plots those years alongside 2026.
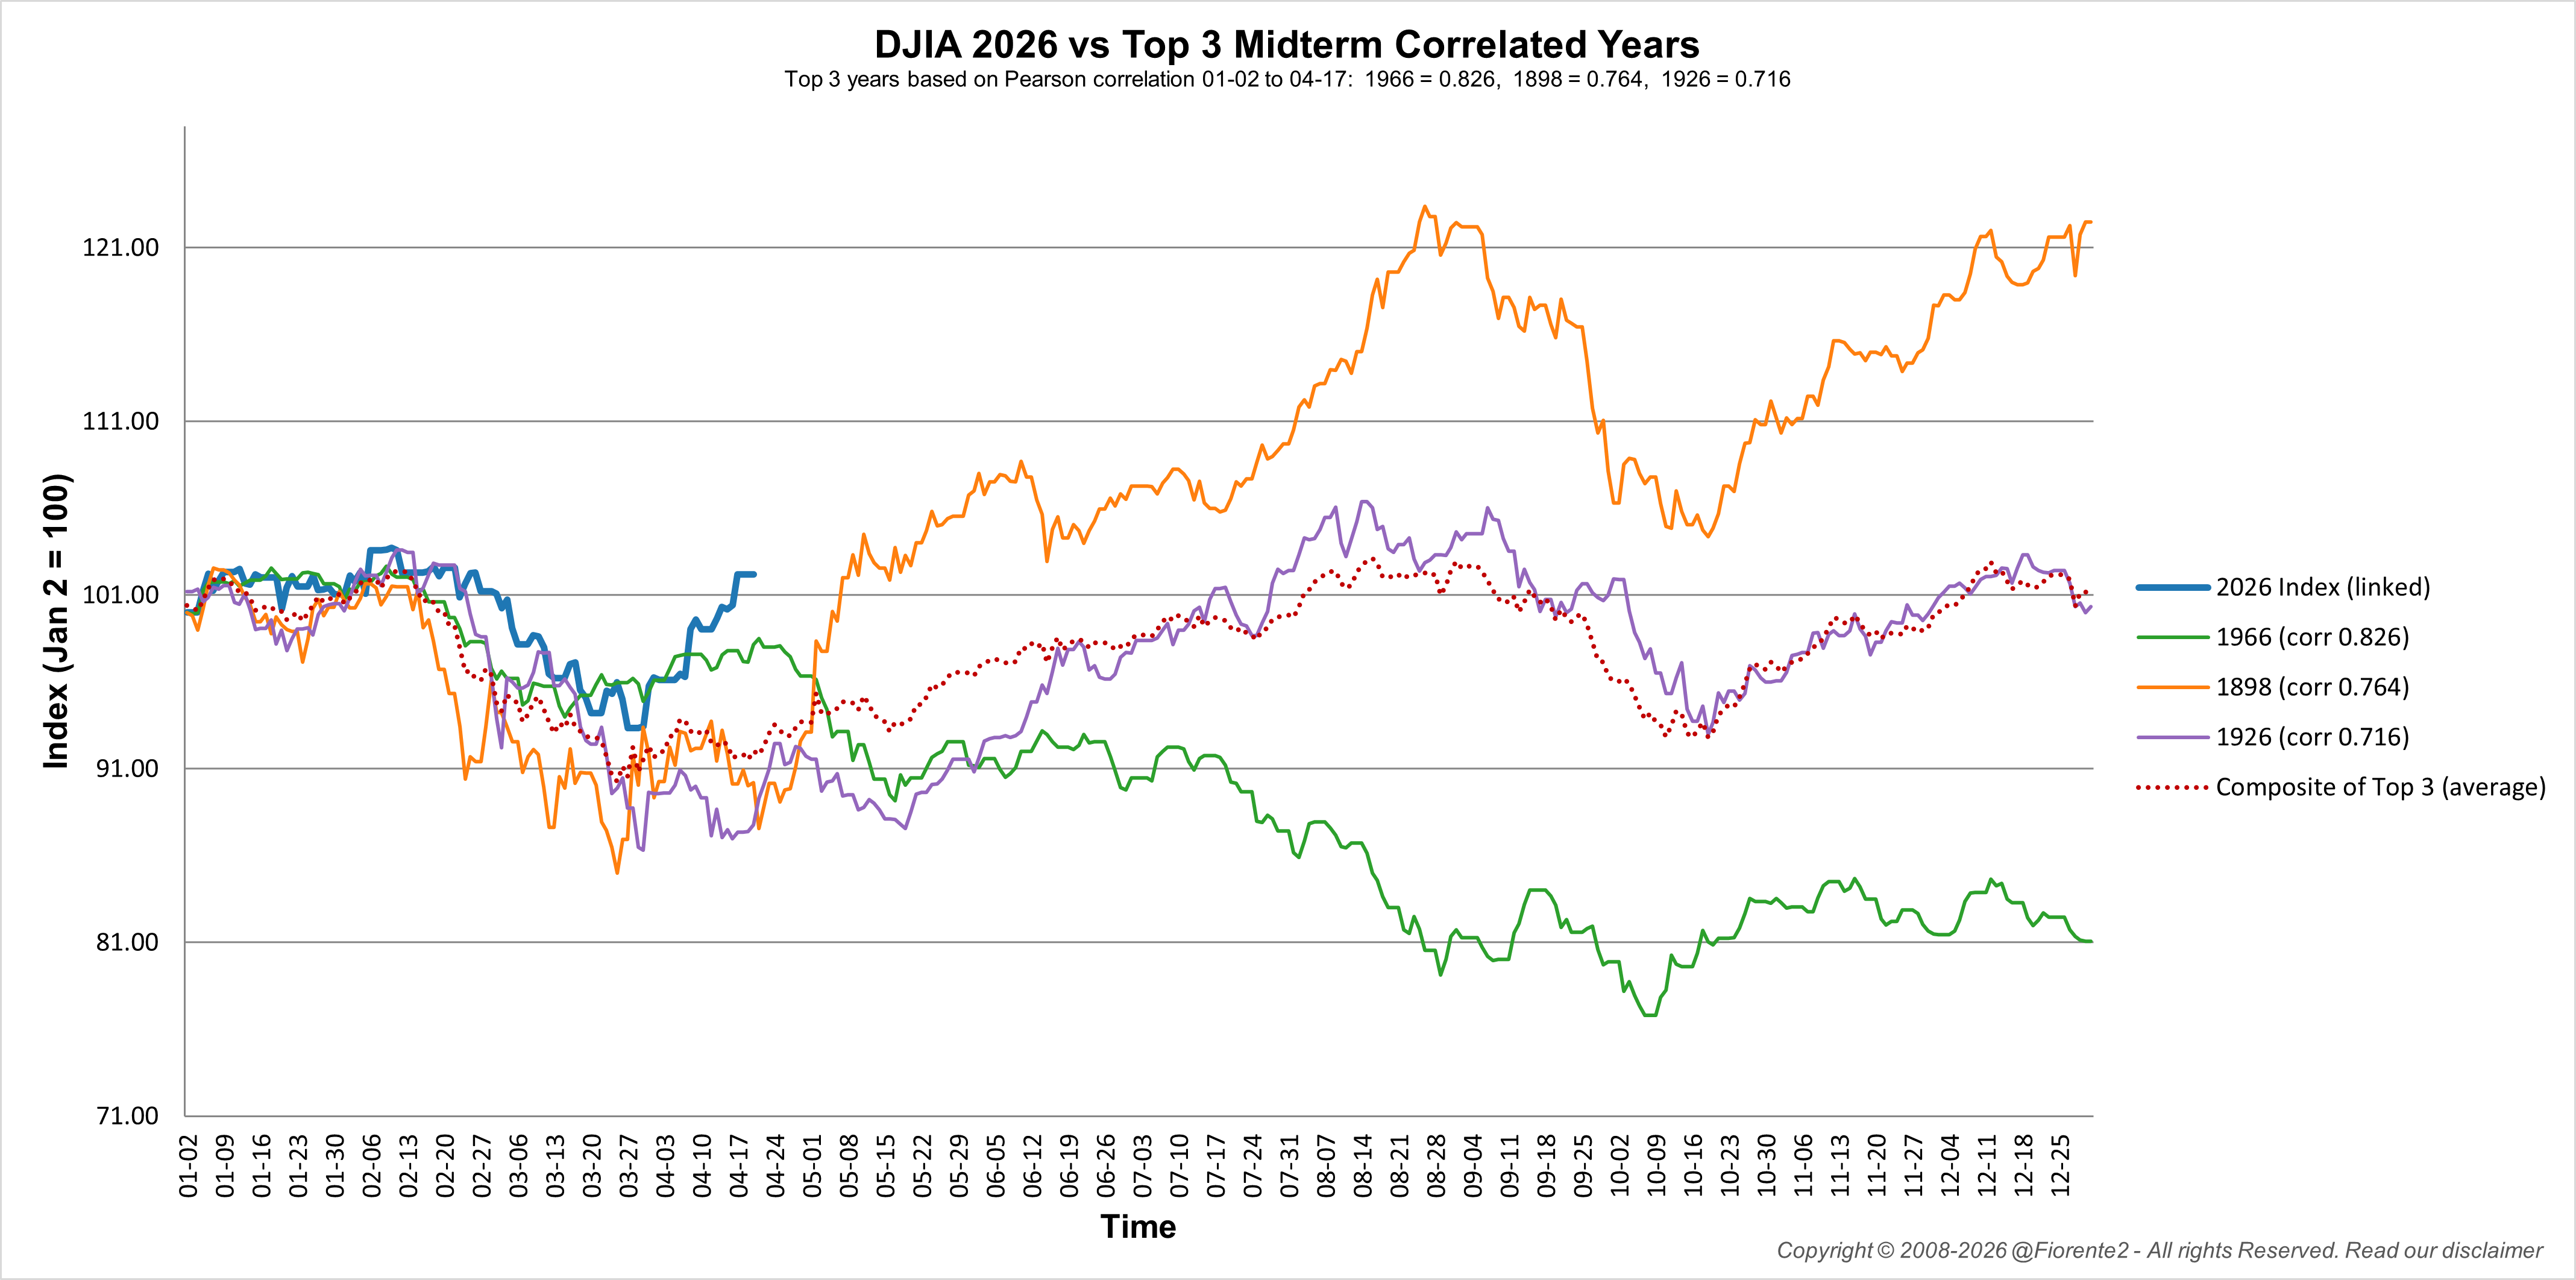
The three years that came to the surface are 1966, 1926, and 1898.
That’s the 60-year cycle, the 100-year cycle, and a 128-year cycle, all surfacing together. The DJIA tracked all three years very closely from January through last week.
1966 has the strongest correlation. 1898 is the bullish outlier: if 2026 follows that path, the market could go bazooka from here. 1926 sits in the middle, and curiously, its path aligns with the average of the top 3, a sideways drift that echoes the broader 35-year midterm average.
Each of these years carries its own resonance. In 1898, the US was just emerging as a global power, through victory in the Spanish-American War, trying to gain military and economic power across the Pacific and Caribbean, from the Philippines, Guam, and Puerto Rico to annexing Hawaii. (Source: Office of the Historian.gov)
In 1926, an industrial revolution was reshaping the economy. In 1966, tariffs, war, inflation, and a punishing midterm election. The themes present in 2026 sit closest to 1966 and 1898. Though I’ll admit the 1926 parallel, AI today versus electrification then, is not easy to dismiss.
My bias: the 1966 analog
My bias is for 1966. The correlation from January through last week is the strongest of the three. And the themes are too close to ignore: tariffs, a costly overseas conflict with no clear exit, inflation concerns, and a midterm election that may punish the incumbent party. The DJIA fell roughly 25% in 1966.
I haven’t made this chart dynamically adjustable for today’s volatility yet. But the direction is visible. I’ll update it week to week to see how the midterm year plays out.
Of course, I can be wrong. Other years may become more dominant as we move forward. The cycles can invert.
Conclusion
The midterm year in 2026 is following the pattern I’d expect. The tiger is ferocious. The sentiment is volatile. And the market is reflecting both.
The top 3 analogs, 1966, 1926, and 1898, all tracked 2026 closely through last week. From here, the paths diverge sharply. In the next month or two, the picture should become clearer.
This is my bias for now. I’ll follow it week to week and update the charts as new data comes in. The next few weeks will tell us quite a bit.
Remember, cycles can contract, extend, and invert. I may be wrong, of course. Anomalies can occur, fundamentals can shift, so be cautious. No advice. Be careful out there.
In case you haven’t noticed, I post various charts in the Substack notes every week. You can find them all here. (click on the link)
P.S.: Occasionally, I share new analyses exclusively for free subscribers. Subscribing gives you email updates on these posts, plus extra insights and deeper research from the time you join onward; past analyses are not included.
If you liked this post from @Fiorente2’s Blog, why not restack and share it?
© 2008–2026 Fiorente2.com. All Rights Reserved.
Disclaimer: This analysis is for informational and educational purposes only and should not be considered investment advice. Read our full disclaimer.
Disclosure: From time to time, I may hold positions in the securities mentioned.