

Introduction
In my “Squaring the Cube” (#315) and “Has the high been set yet?” (#316) articles, I mentioned the possibility of a crest around the July to early August 6th, 2026 window. Indeed, the DJIA made a high close to 60 points above my calculated price target of $54,289, based on the square of 233, with both price and time harmonics (10x233 calendar days) from the March 2020 low. Within a couple of days, it was both a close hit in price and time. However, there is no confirmation yet that a high has been set.
Based on the overbalance line (#317) and the largest pullback against the trend since the end of March 2026, the uptrend may still be intact above $52,993, which is 1,751.33 points below the recent high in August. I have not abandoned the possibility of a DJIA crest by early August, but the trend has not been broken, and the SPX made a new high as well, which brings me back to my mid-term analysis.
Mid-term analysis update
In the article “The dip that may only be a ripple” (#314), I mentioned the possibility of the 1898 analog becoming the more dominant analog once the $52,500 price level was broken above.
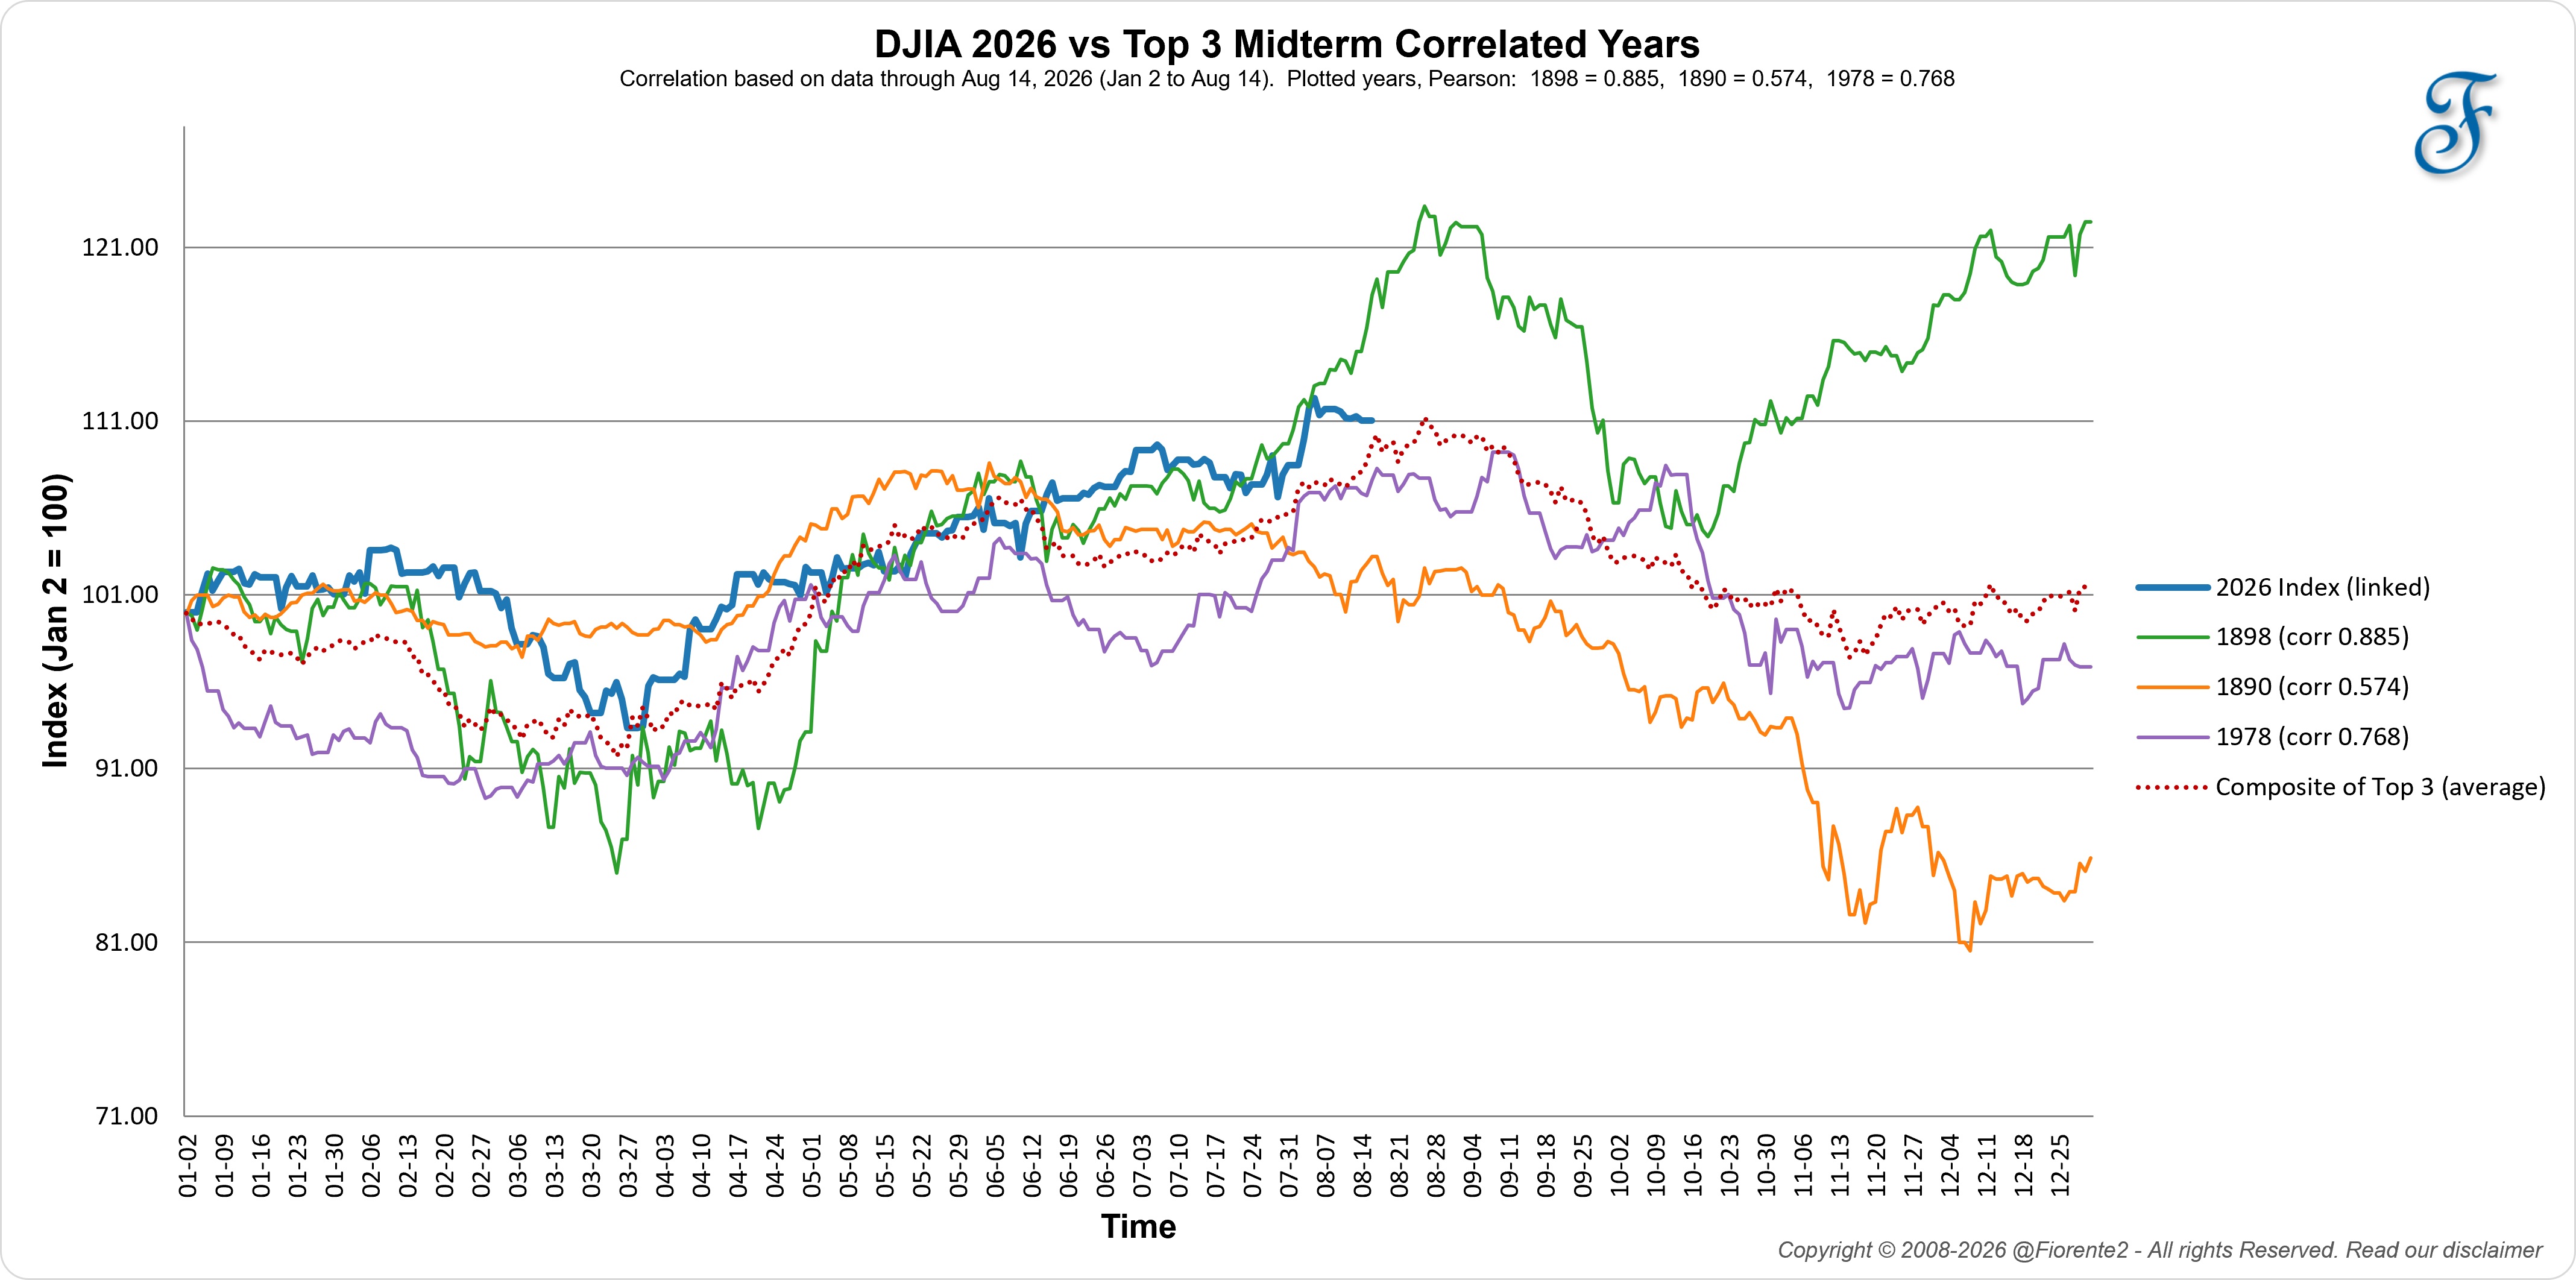
Re-measured through August 14, the 1898 correlation is r = 0.885; for 1890, r = 0.574; and for 1978, r = 0.768, with the top-3 composite at r = 0.87. (Here r is the correlation, how closely each old year’s pattern tracks 2026: 1.0 is a perfect match, 0 is none.) 1898 and 1978 improved since late June, while 1890 eased from r = 0.683 to r = 0.574.
In the same #314 article, I mentioned:
Economic trends mostly turn on the slow combinations of Jupiter, Saturn, and Uranus. The shorter swings come from the faster bodies, the Sun, Moon, Mercury, Venus, and Mars, in aspect to those larger planets: smaller cycles inside the larger cycle of the secular trend. A ship on the ocean takes time to turn because of its speed and mass, and the same can be said for the cycles that involve the larger planets.
Also, the larger cycles mentioned in my “The First Checkpoint” (#309) Gann cycle-cluster article were minimal in July and August. They were heaviest in September, so the weight in the larger cycles may still be ahead of us.
Using the same analog years, my index of cyclical variation (helio), a line that tracks planetary pairs through their separating (more positive) and closing (more negative) phases, agrees with that analysis.
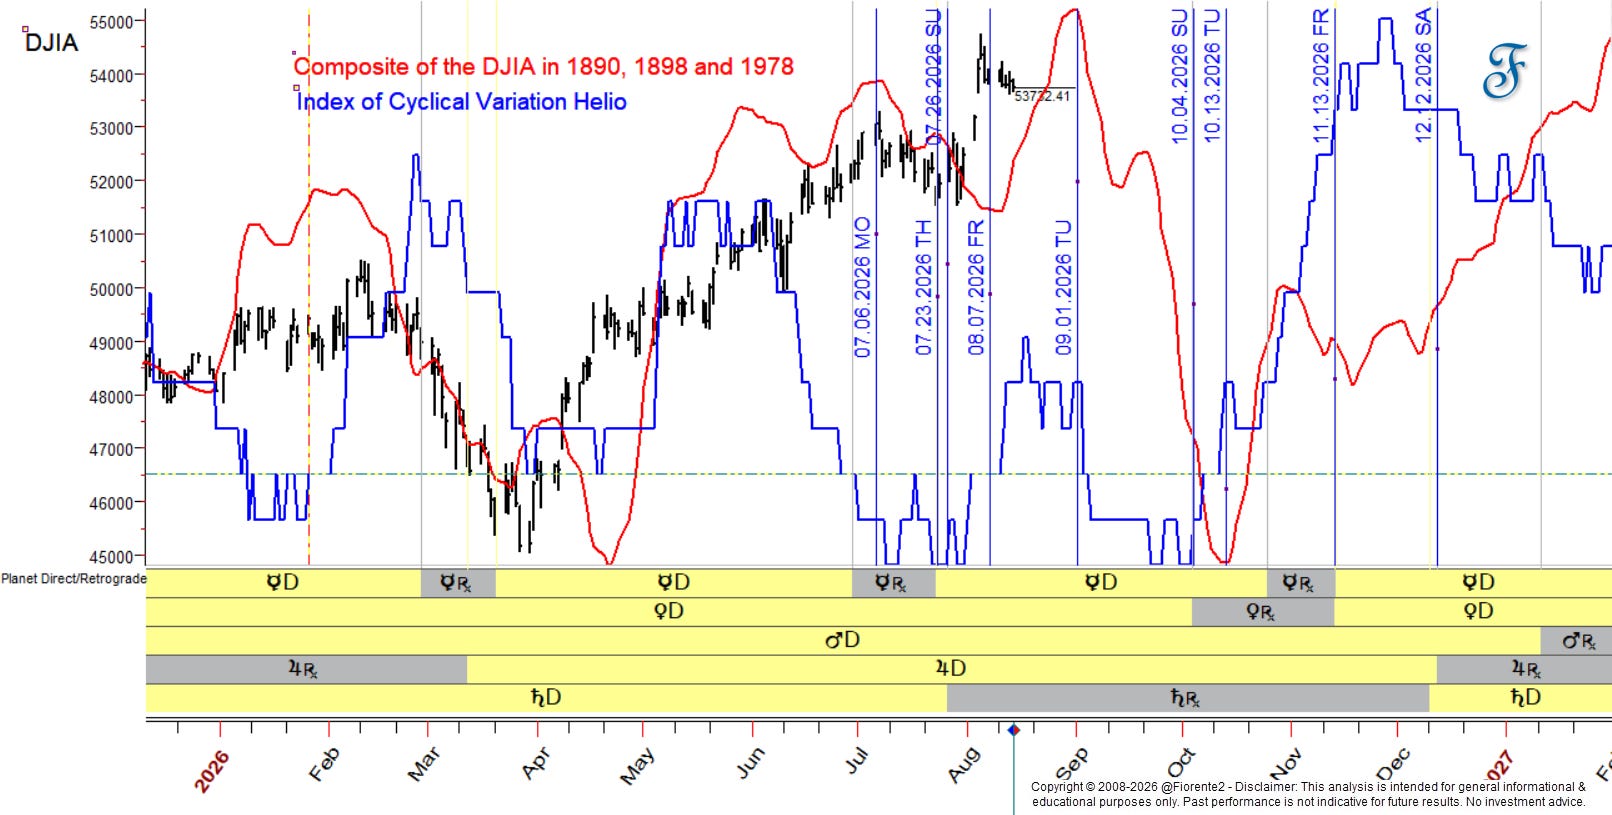
I really do not know whether the market will continue to follow the composite of these past mid-term years, but in all those years, a dip set in around October and, in some years, it continued through year-end.
As cycles can contract and extend, we need to consider the possibility of an inversion. So far, the market has inverted on a 60-year cycle (correlation of -0.60). So I would not stare blindly at the chart above. At some point, these analogs will cease to function. So, what is an alternative scenario to take into account when the uptrend continues?
The 32- and 45-week time cycle
In recent weeks, I have been following the 32- and 45-week cycles, which show an interesting correlation with Venus’s planetary cycle.
When you look at the recent chart of the DJIA, you can see that the market reacted to the April 7th low when Venus was around 212 degrees (heliocentric), and again in November 2025 and early July 2026. The turns are at 32-week intervals (approx. 225 days). The cycle of Venus: each time it made a 90-degree aspect to Pluto, the market moved.
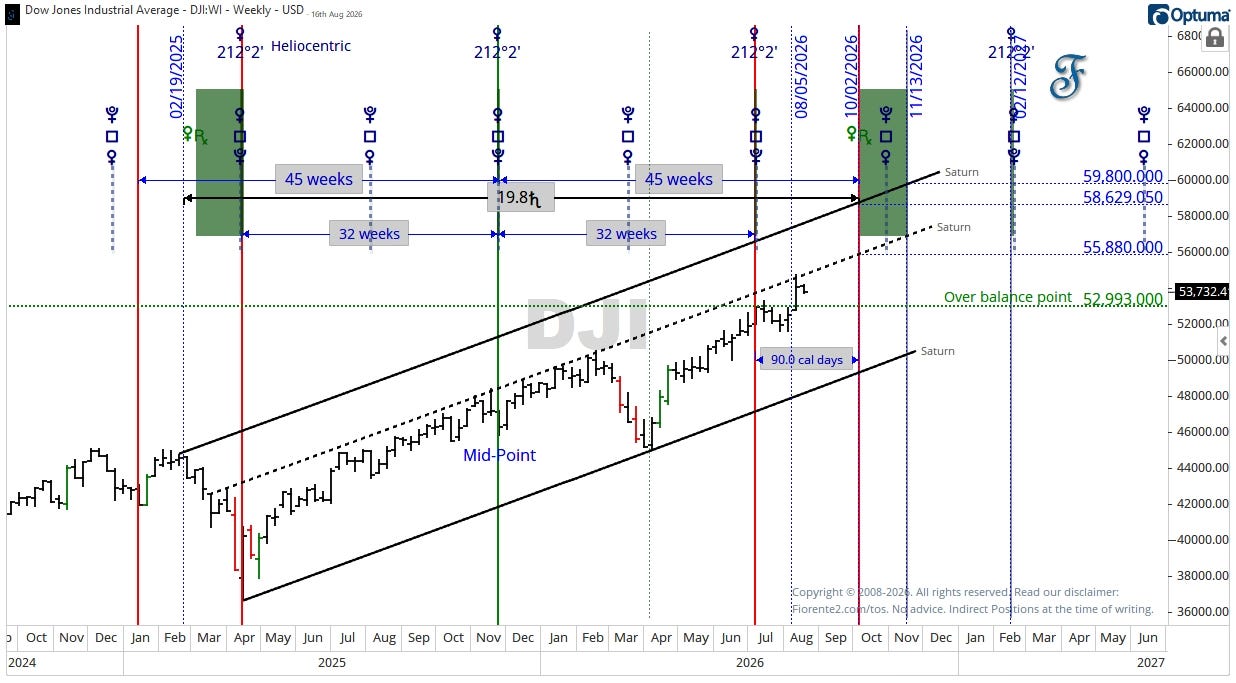
Back on April 7th, 2025, the market declined during a Venus Rx (retrograde) period, as shown in green on the chart above. Often, the market reverses around these periods and there is an upcoming retrograde period in October through November 2026.
The interesting thing is that the 13-week, or approximately 90-day, period between the 32- and 45-week sequences, plotted on the chart as red solid vertical lines from the midpoint, tends to alternate in polarity relative to the last time. This may call for a higher high than I expected.
I have plotted a channel using Saturn's heliocentric motion at a price unit of $700 per degree from the highs and lows to extrapolate where a possible high may occur if the trend continues toward higher price levels. Drawing it is like laying a simple trendline across the important lows, then copying that same line onto the important highs, so the two run parallel as a channel.
I use a planet's motion for the slope rather than plain calendar days, because it links price and time. Where price reaches the line, price and time come into balance.
A similar analysis can be done for the SPX. The only difference in the chart below is the channel I based it on: the heliocentric motion of Venus at a price unit of $2.618 per degree.
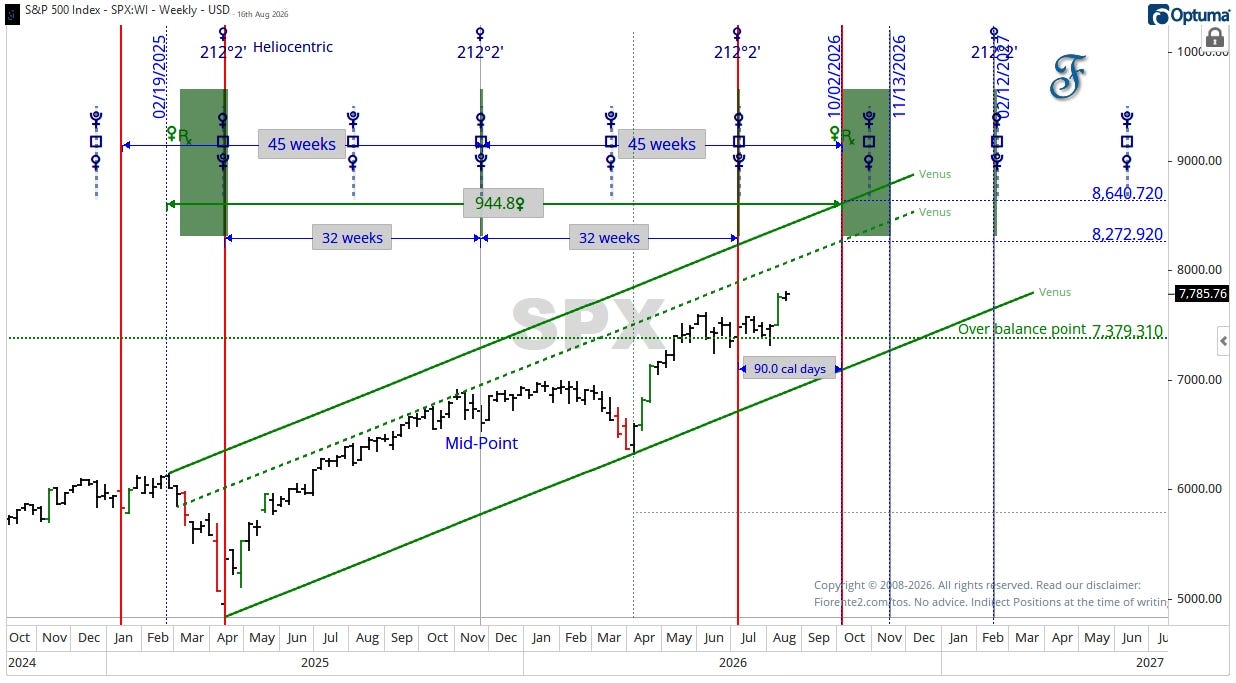
Note: 2.618 is a harmonic of the golden ratio (0.618), which is a ratio very close to the rotation of Venus around the Sun. (225/365.25)
Conclusion
In the past week, the DJIA stalled while the SPX made a new high. Perhaps this signals the high has not been set yet, or that the divergence is a condition to be cautious about. In neither index has a clear high been confirmed, as the overbalance points are both intact.
That leaves two paths open from here. The mid-term analogs still point to a retest or marginal higher high into early September and an autumn dip around October, my base case. In the alternative scenario, the 60-year cycle has inverted to an October high, and the 32- and 45-week Venus intervals may point to a higher high into the next Venus retrograde period, from early October to mid-November 2026.
This is my bias for now. Always keep in mind that cycles can contract, extend, or invert, and anomalies can arise. So, be careful out there. No advice.
Remember, cycles can contract, extend, and invert. I may be wrong, of course. Anomalies can occur, fundamentals can shift, so be cautious.
In case you haven’t noticed, I post various charts in the Substack notes every week. You can find them all here. (click on the link)
If you liked this post from @Fiorente2’s Blog, why not restack and share it?
© 2008–2026 Fiorente2.com. All Rights Reserved.
Disclaimer: This analysis is for informational and educational purposes only and should not be considered investment advice. Read our full disclaimer.
Disclosure: From time to time, I may hold positions in the securities mentioned.