

Introduction
Last week in $DJIA, Has the high been set yet? (#316) I put the cube window at July 29 to August 6 and said the year’s high is probably not in yet. On Friday the Dow closed 51,947.25, still chopping under the 52,500 line it broke on July 17.
In early trade today the Dow has pushed back above 52,500. I read the daily close, so a close back above 52,500 is what would put the 1898 path in front again.
This is a short one. The notes don’t reach every subscriber, so I’m putting the geometry in the mail.
$DJIA, the two hexagon corners
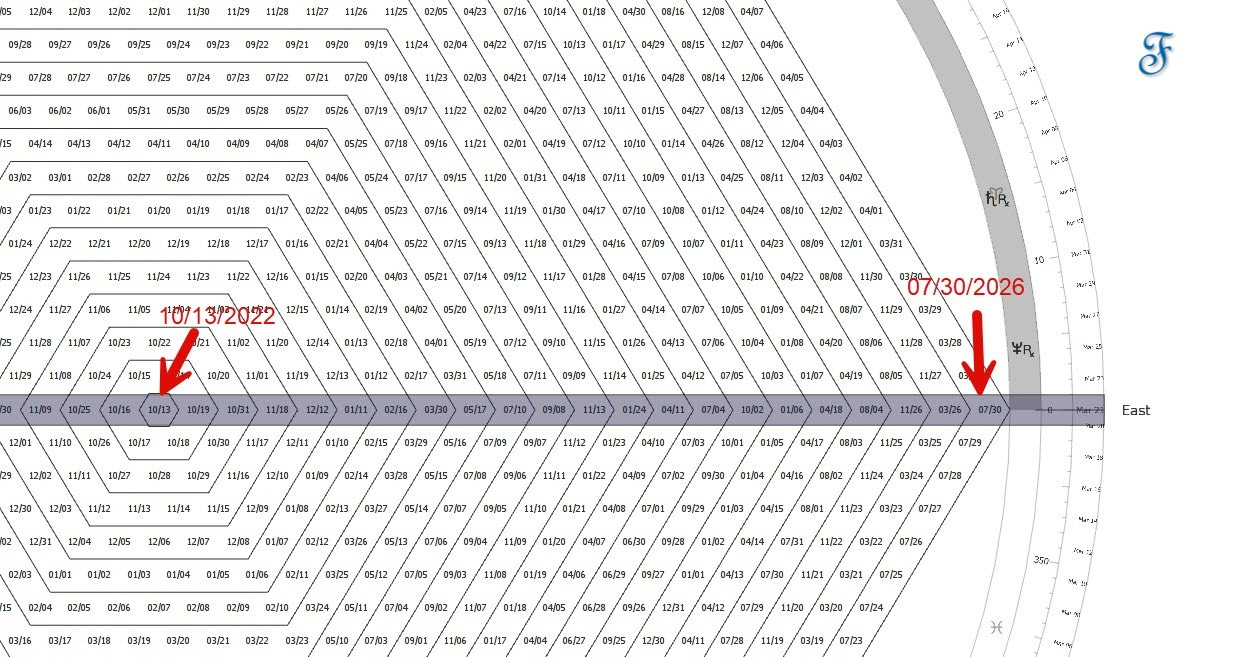
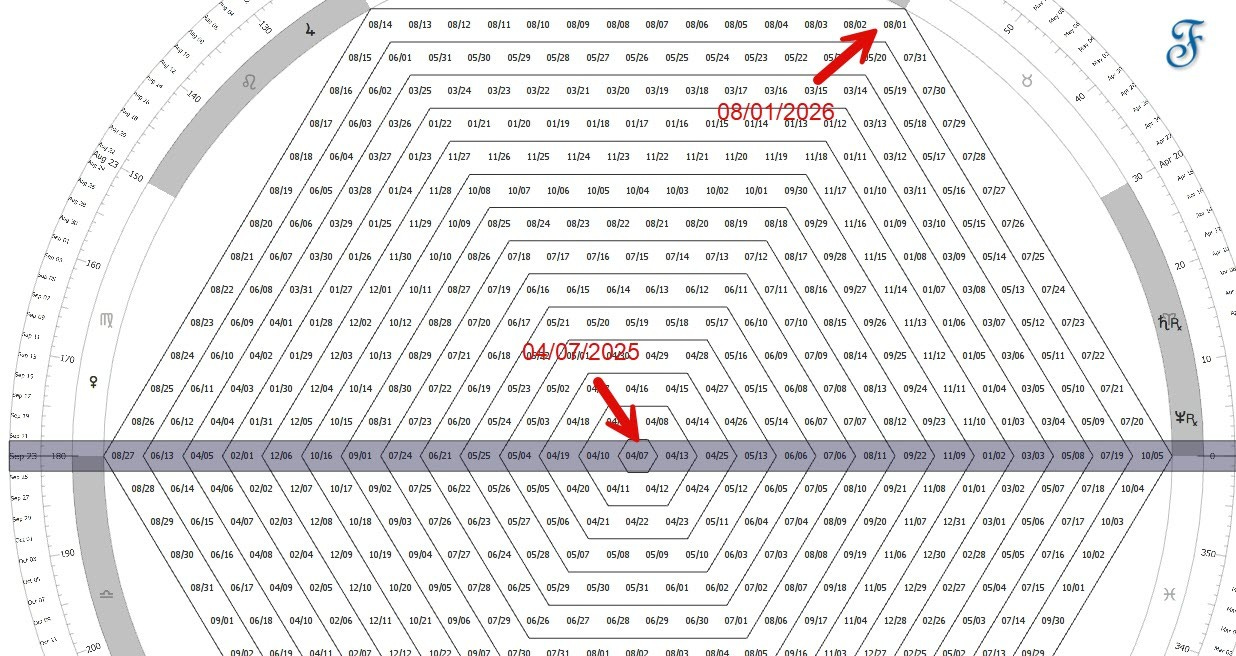
The hexagon is the cube seen head on: a six-sided figure, each side 60 degrees, 360 degrees for a full turn. Same solid as the cube in the #315 post, one face forward. On the two charts below, the dates spiral out from each low at the center, and the corner the count reaches next is the date to watch.
From the April 7, 2025 low at 36,611, one side on, the next corner lands August 1, 2026, 481 days out. Two corners of the same geometry, two days apart, both inside the July 29 to August 6 window.
Two corners fall on the window. From the October 13, 2022 low at 28,660, the bear-market bottom and the change in trend, a full turn of the hexagon lands the next corner on July 30, 2026, 1,386 days on.
Note: the same Venus-Jupiter grid I track under the cube marks these days in heliocentric degrees too, the layer I ran under the cube in my #315 post. Gann measured time in degrees as well as days, so the same days read on both scales.
So the hexagon is a third method, after the cube and the Fibonacci count, landing on July 30 and August 1, already inside the time window I mentioned in last week’s post (#316 ). It tightens the window I set, drawn a third way.
What a change of trend would show
Gann never leaned on one signal, so here is the set I’m watching, from the softest reading to the firmest.
Since July 7 the picture has softened a touch. The Dow has made two lower tops off the 53,289.30 high, 52,924.86 on July 16 and 52,511.21 on July 22. A market making lower tops is the weak side of his form reading, and the third or fourth lower top is where he sold rallies.
A weak picture still falls short of a turn, and this is the part that keeps me patient. In a bull market a normal reaction runs 3 to 4 weeks, and once it passes four it can stretch to 6 or 7. The pullback from July 7 is about two and a half weeks old. So it can run deeper and longer, well into the early-August window, and still be a normal reaction inside the uptrend rather than a change of the main trend.
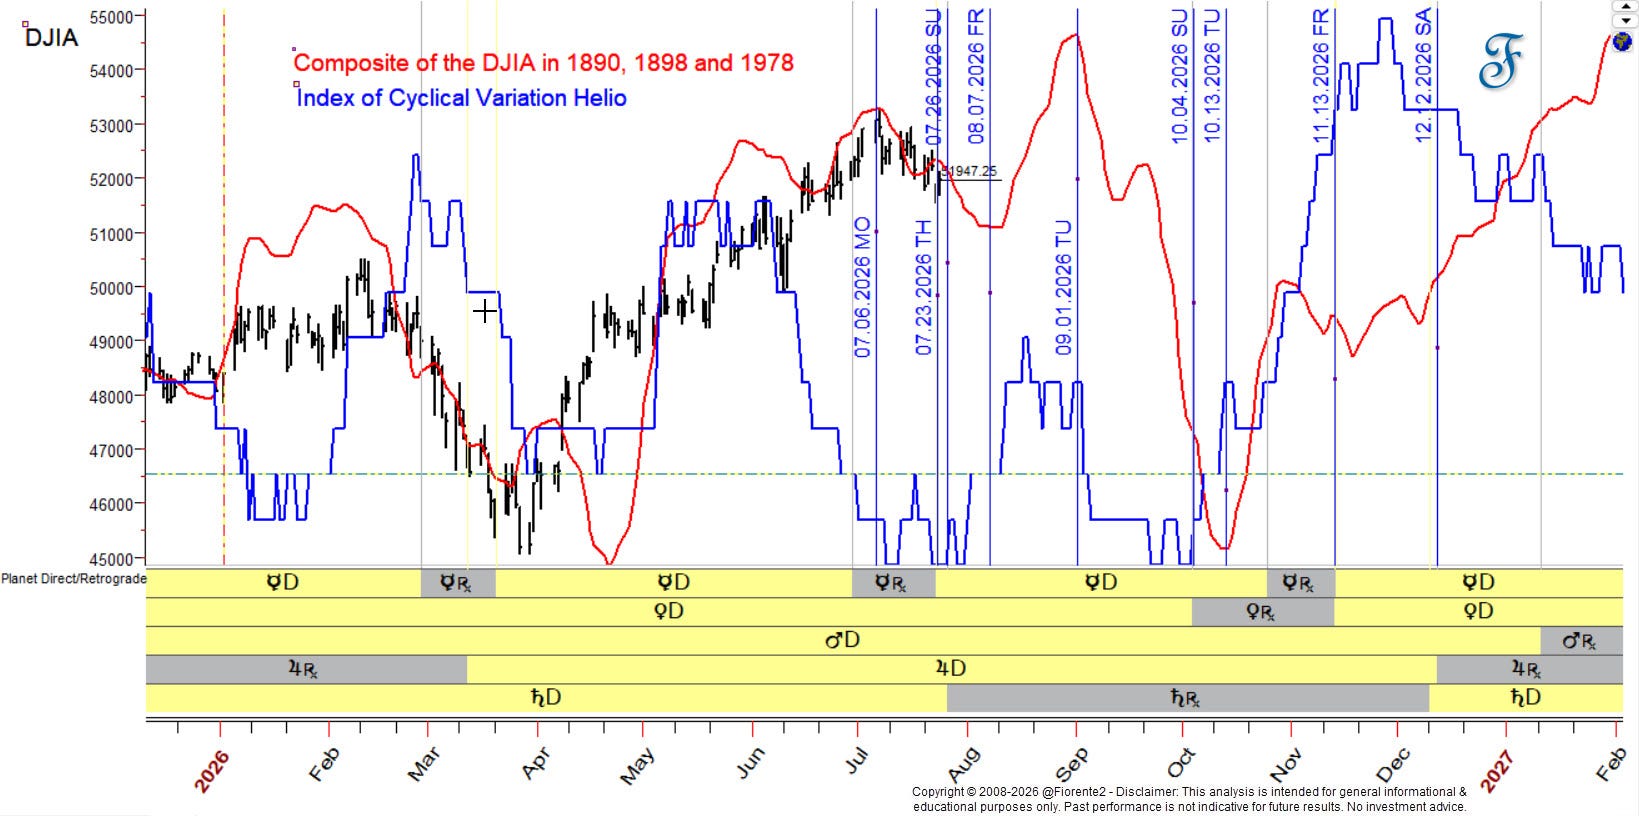
It also sits with last week’s read. The analog set and the index of cyclical variation in last week’s chart 3 (#316) both pointed down into end of July to early August, and the drift off the July 7 high tracks that path.
Two things would move it from reaction to turn. The first is Gann’s overbalancing of space.1
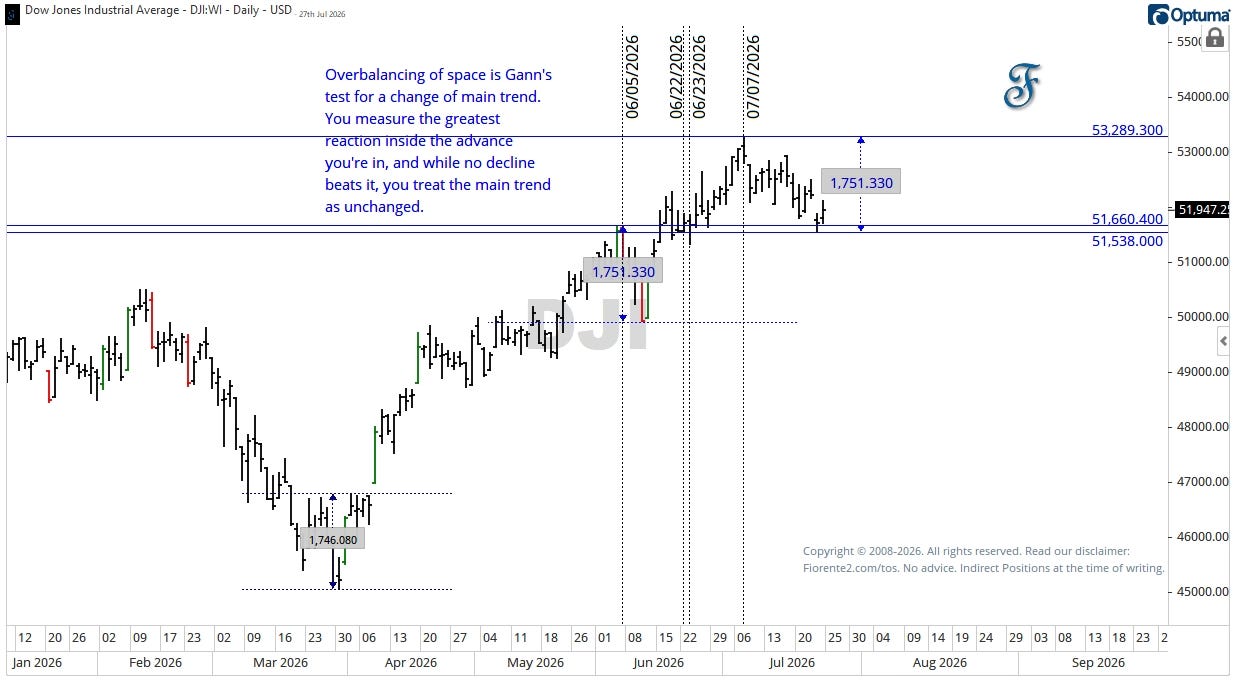
The largest reaction inside the advance from the March 30 pivot ran 1,751 points, the June 5 high at 51,660.40 down to the June 10 low at 49,909.07. The chart marks a near-equal reaction of 1,746 points earlier in the move, and both project down from the July 7 high at 53,289.30 to about 51,540.
Call the line 51,538 on the greater of the two. The July 23 low at 51,542.06 came within 4 points of it, so a daily close below 51,538 overbalances the move and doubles as a break of that July 23 low, two methods on one number. A weekly close under the June 23 low at 51,301.77 breaks back through several weeks’ bottoms as the confirmation.
The second is the double top. If price rallies back into the window and stalls near the 53,254 cube boundary and the 53,289 high, then breaks the reaction low between, that is his “M” top, a failed retest of the high. In last week’s newsletter (#316), I kept the larger version of it up at 54,289 (squaring 233), tagged and retested. Either one makes the top on a second failure, the retest Gann waited for.
Conclusion
The hexagon adds two corners to a window I already set, so I read July 30 to August 1 as the tighter edge of the July 29 to August 6 zone. A normal bull-market reaction runs 3 to 4 weeks, so counting from the July 7 high the pullback carries into that same window before Gann’s clock says much either way.
Which way price leaves 51,538 is the one thing I’m watching.
This is my bias for now. (No advice.)
Remember, cycles can contract, extend, and invert. I may be wrong, of course. Anomalies can occur, fundamentals can shift, so be cautious.
In case you haven’t noticed, I post various charts in the Substack notes every week. You can find them all here. (click on the link)
I’m taking some time off this week, so there’s no issue between now and then.
P.S.: The next full issue publishes the week of August 2, once the July 29 to August 6 window has closed. This note is the geometry behind the window, and the lines just under it. If the Dow closes below 51,538 while I’m away, that scores the overbalance, and I’ll cover it in that issue. Free subscribers get it by email from the day they join.
If you liked this post from @Fiorente2’s Blog, why not restack and share it?
© 2008–2026 Fiorente2.com. All Rights Reserved.
Disclaimer: This analysis is for informational and educational purposes only and should not be considered investment advice. Read our full disclaimer.
Disclosure: From time to time, I may hold positions in the securities mentioned.
Overbalancing of space is Gann’s test for a change of main trend. You measure the greatest reaction inside the advance you’re in, and while no decline beats it, you treat the main trend as unchanged. A decline that overbalances it, giving back more points than that greatest move, is his signal the trend has turned, and the rule runs in reverse through a decline, measured on the greatest rally. Think of the largest reaction so far as a yardstick: while price holds inside it the uptrend stands, and once a pullback runs past it a reversal may have set in.