
Wheels Within Wheels
#303 | The Mars/Venus composite cycle and what it implies for the US indices into July 2026

Introduction
There are two cycles I haven’t shown you yet. The cycles of Mars and Venus that run together. Three cycles of Venus helio fit almost perfectly in one cycle of Mars.
1 × Mars = 686.98 calendar days. 3 × Venus = 674.10 calendar days. Those two run within 1.91% of each other. When two independent planetary cycles land that close to the same period, the timing signal carries more weight than either alone.
Together, they point to a major inflection around July 2nd–4th, 2026. The DJIA, S&P 500, Nasdaq 100, and NYSE Composite all sit in this cycle’s path. Whether July 4th turns out to be a major low or a major high is the honest question I’ll work through in this newsletter update. I don’t have a certain answer. The coming weeks should start to provide one.
New readers may want to start with my latest posts: #299 - My Banker Called Me Nuts and #300 - New Highs and the Jupiter-Saturn Clock, where I covered the 60-year cycle, the 4-year cycle, and the Jupiter-Saturn framework that brought us to this point.
The Mars/Venus - Pluto cycles
The large red semi-circle on the DJIA chart below ranges from approximately August 2024 to early July 2026, 686 calendar days. It crested near the February 10th all-time high on the DJIA. The semi-circle’s projected trough falls on July 2nd–4th, 2026, where the 4-year and 60-year cycles are expected to land.
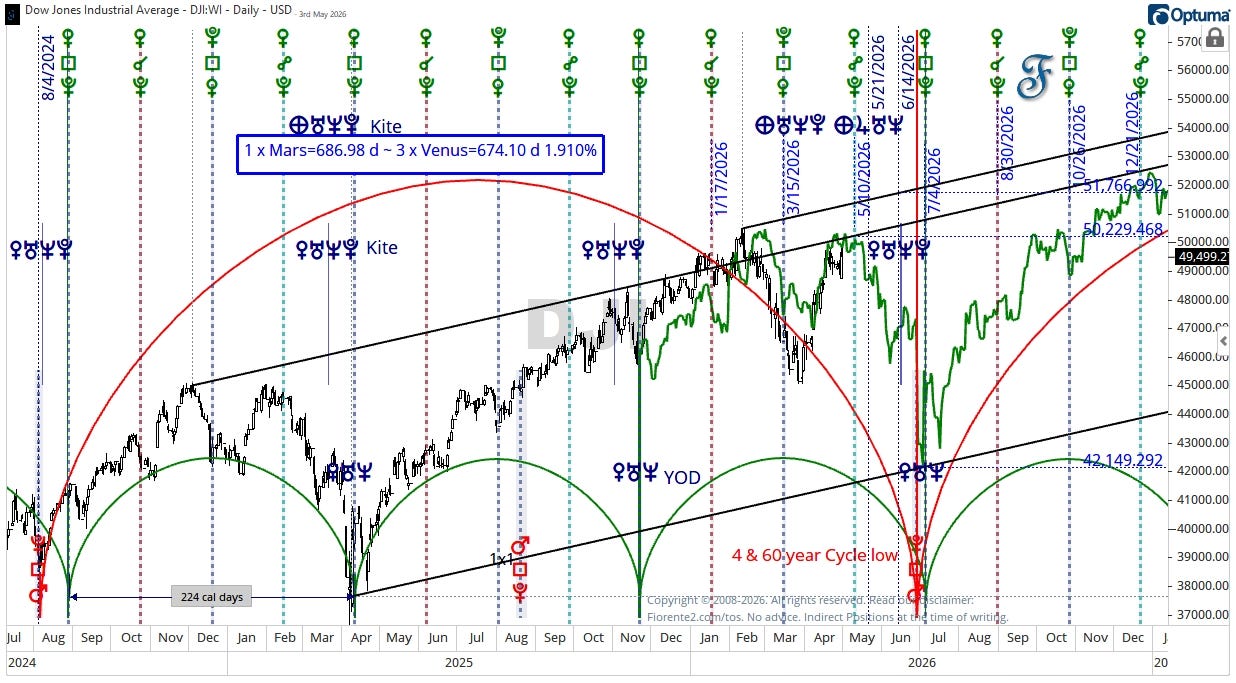
Two additional cycles sit alongside it. The Venus-Pluto and Mars-Pluto heliocentric cycles, with the Venus square Pluto and Mars square Pluto aspects as important inflection points. These have marked turning points in the US indices in prior cycles, and they’re heading to a similar square aspect with Pluto in the same July window.
The chart also shows four Kite formations (planetary geometries) from a heliocentric view involving:
Venus, Uranus, Neptune, and Pluto, as seen in August 2024, one in March 2025, one in early November 2025 and one around mid-June 2026
Earth, Uranus, Neptune and Pluto, as seen in March 2025 and March 2026
Earth, Jupiter, Uranus and Neptune unfolding in third week of May 2026
A Kite is a Grand Trine anchored by an opposition: four planets in a configuration, perhaps guiding or forcing the trend toward a specific target, a low or a high.
A Kite has three components.
The body is a Grand Trine: three planets positioned 120° apart, forming an equilateral triangle. Harmonious by nature, but passive. Left alone, a Grand Trine rarely produces a sharp directional move.
The tail changes that. A fourth planet sits in opposition (180°) to one corner of the triangle. That tension activates the trine, converting harmony into directed energy.
The fourth planet also forms two sextiles (60°) with the other two corners. These act as stabilizers, giving the whole configuration a clear focal point. The result: momentum with a target.
These Kites may have been the cause for the bull market’s momentum through 2025 and into mid-2026. Whether they drove it or simply reflected it, the geometries since August 2024 were in harmony with the strong trend.
There is another geometry worth mentioning from a helio perspective. In 2025, a Yod (Venus, Uranus, Neptune) synced up with the low in April 2025 and the November 2025 low. The next one unfolds early July 2026.
The Yod, sometimes called the Finger of God, forms when two planets in sextile both form quincunx [150°] aspects to a third. It tends to mark a point of focused tension, a change in character.
Looking at the chart, at the first two instances in 2025, the Yod fell into the Venus square Pluto aspects. The Yod marked the end of a short-term decline, in a longer-term uptrend supported by the Kite formations.
Venus rules money and value. Neptune feeds the illusion that markets can only go higher, that speculation is rational, that the trend has no ceiling. Together they make the crowd believe in the move right up until it ends.
Uranus is the disruptor. Sudden shocks, volatility, behavior that can go either way.
When all three land in the same geometry, the signal gets harder to read. The mix leans volatile, and volatile windows can resolve either way. That’s part of why a potential low of July 2nd–4th may resolve as a high instead.
Hence, the semi-circles on the above chart are potential inflection points, either a high or a low.
The DJIA closed at 49,499 on May 1st. That’s roughly 2% below the February intraday high of 50,512, consolidating in a range the market hasn’t broken since April 17th. Three attempts at the 49,720 level. Three failures.
In #300, I flagged April 22nd as the Jupiter-Saturn geocentric crest date. The market has been unable to push meaningfully past that level since, which is consistent with the semi-circle’s behavior after a crest. However, the Venus opposition Pluto aspect may hint that the fourth attempt breaks through.
The US indices
The four indices: DJIA, S&P 500, Nasdaq 100 and the NYSE Composite are not in the same place right now, and that gap matters.
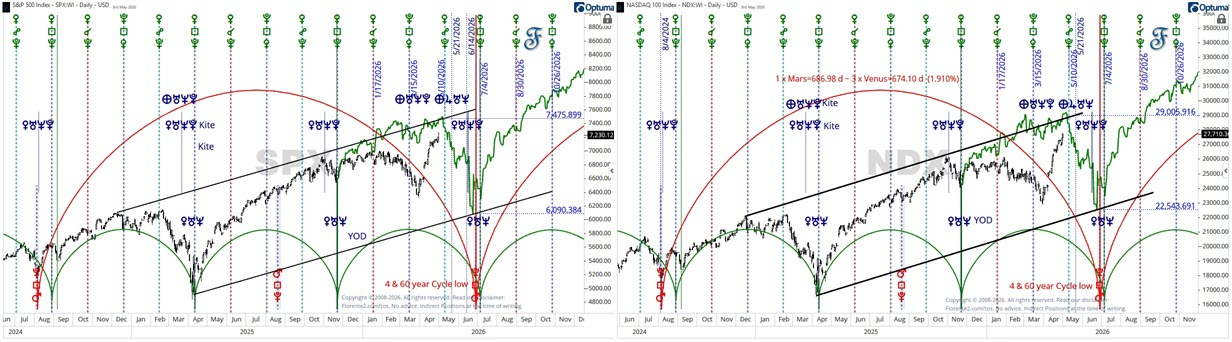
The S&P 500 and Nasdaq 100 have pushed to new all-time highs since February 10th. The DJIA has not. It still needs to clear 50,512 to confirm the breakout. That divergence (the S&P and Nasdaq leading while the DJIA trails) is intermarket bearish divergence. It’s been in effect since the February peak and it hasn’t resolved.
The broader NYSE Composite index is in a similar position as the DJIA and hasn’t broken the all-time highs of early 2026 yet.
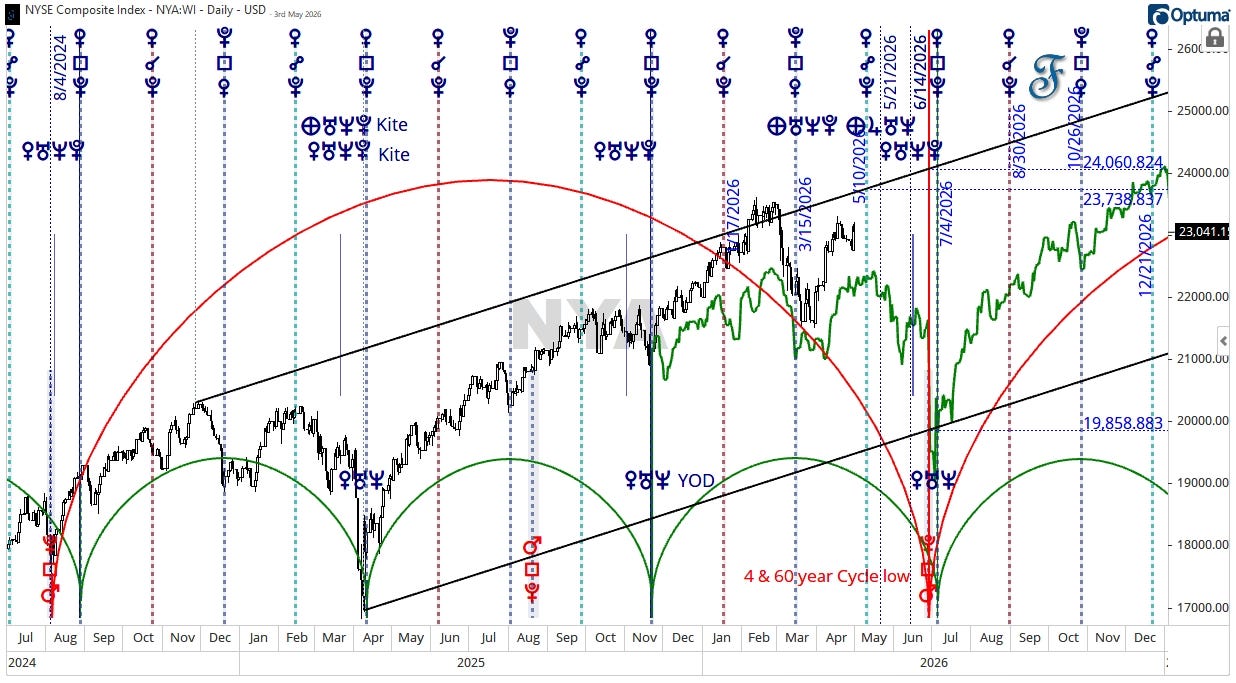
Historically, when the headline indices break to new highs but the DJIA fails to confirm, the breakout tends to be fragile. The cycle structure across all four still points to the same July window. But the DJIA’s lag is consistent with a distribution phase, and that fits the low scenario better than the inversion case.
The near-term hotspots on the way to July: May 10th, May 21st–22nd, and June 14th. Think of these as potential short-term inflection points within the larger move, not the cycle low itself.
Two scenarios into July
If the semi-circle plays out as a low, the DJIA target near July 4th sits around 42,149. From current price, that’s a further decline of roughly 15%.
The inversion scenario: the current consolidation near 49,500 resolves upward, the DJIA clears 50,512, and July 4th marks a high instead. The real decline would then start from there.
My bias is toward the low scenario. Back in my post: #286 - Kicking Off 2026, published January 17th, I outlined five long-term cycles all pointing to a high between January and May 2026, followed by a decline.
Among them: Louise McWhirter’s 18.6-year cycle of the Moon’s North Node, the 22-year solar cycle, and the 60-year cycle and 1966 analog from my Newsletter #299. They all pointed the same way. The February 10th all-time high landed right in that window.
In my newsletter #282 - The Long-term cycles in US Indices, I wrote:
“As many long-term cycles are making favorable aspects, such as the Saturn-Jupiter trine (within 1 degree), the Uranus-Neptune, and the Saturn-Uranus sextiles, we may see a high in the stock market at any time between now and mid-April to early May 2026. At this time, the North Node will reach a point in time that also coincides with the October 2007 high. Long-term cycles move slowly.”
It was time for them to crest. The February high landed almost exactly where the setup said it would.
In my newsletter: #300 | New Highs and the Jupiter-Saturn Clock, I called the April bounce the “second crest” scenario, a short-term recovery within a longer downtrend. That’s still my read. The DJIA’s failure to confirm the S&P and Nasdaq breakout only adds weight to it. But the inversion carries real probability. I’ve seen this cycle flip before. The May 10th and May 21st–22nd hotspots should start to tell us which path the market is on.
Conclusion
Over the past couple of months I have discussed several important cycles while the US stock market continued to even higher highs. It shows that when multiple long-term cycles and several geometries are unfolding it may be hard to forecast when the overall market will roll over.
The Mars/Venus composite is a new analytical layer on top of the 60-year cycle, the 4-year cycle, and the Jupiter-Saturn framework we discussed earlier. It points to the same early July window from a different starting point. When independent cycles arrive at the same date without being fitted to each other, I take that seriously.
If the current trend continues into that time window, the upcoming squares of Mars and Venus with Pluto may mark a high, instead of an expected low around the Venus-Uranus-Neptune Yod. The three Yods in 2025-2026 will then have a low-low-high sequence, which is often seen in the stock market.
I’ll be watching the chart closely. If the indices are still pressing against resistance by May 21st–22nd, the low scenario stays on the table. If the DJIA has pushed through 50,512 to new all-time highs, the inversion case around the Yod and the Venus and Mars square Pluto aspects gains probability.
Time may tell.
Remember, cycles can contract, extend, and invert. I may be wrong, of course. Anomalies can occur, fundamentals can shift, so be cautious.
In case you haven’t noticed, I post various charts in the Substack notes every week. You can find them all here. (click on the link)
P.S.: Occasionally, I share new analyses exclusively for free subscribers. Subscribing gives you email updates on these posts, plus extra insights and deeper research from the time you join onward; past analyses are not included.
If you liked this post from @Fiorente2’s Blog, why not restack and share it?
© 2008–2026 Fiorente2.com. All Rights Reserved.
Disclaimer: This analysis is for informational and educational purposes only and should not be considered investment advice. Read our full disclaimer.
Disclosure: From time to time, I may hold positions in the securities mentioned.
Fiorente! This was very useful and I am back at reading this today waiting for things to evolve...waiting for your opinion
Thank you very much for another great article