

Introduction
Last week, I was re-reading André Barbault’s book on Planetary Cycles (2014). He was a famous Astrologer, much respected for his commentaries on Mundane Astrology. On the Saturn-Neptune cycle, which has the next conjunction on February 20th, 2026, he mentioned on page 103 that this conjunction is “the most benefic configuration of the century and its interplanetary partnership will work for the best in a splendid relaunch of civilization.”
I’m curious whether his commentary could also apply to the stock market, running into a February 2026 high. It is possible as the 60-year nominal cycle had its high in February 1966. Twice the 60-year cycle (the 120-year Vedic cycle) peaked in mid-January 1906, so it is possible we may see the stock market continue to a 2026 high from a long-term perspective.
The 60-year Cycle
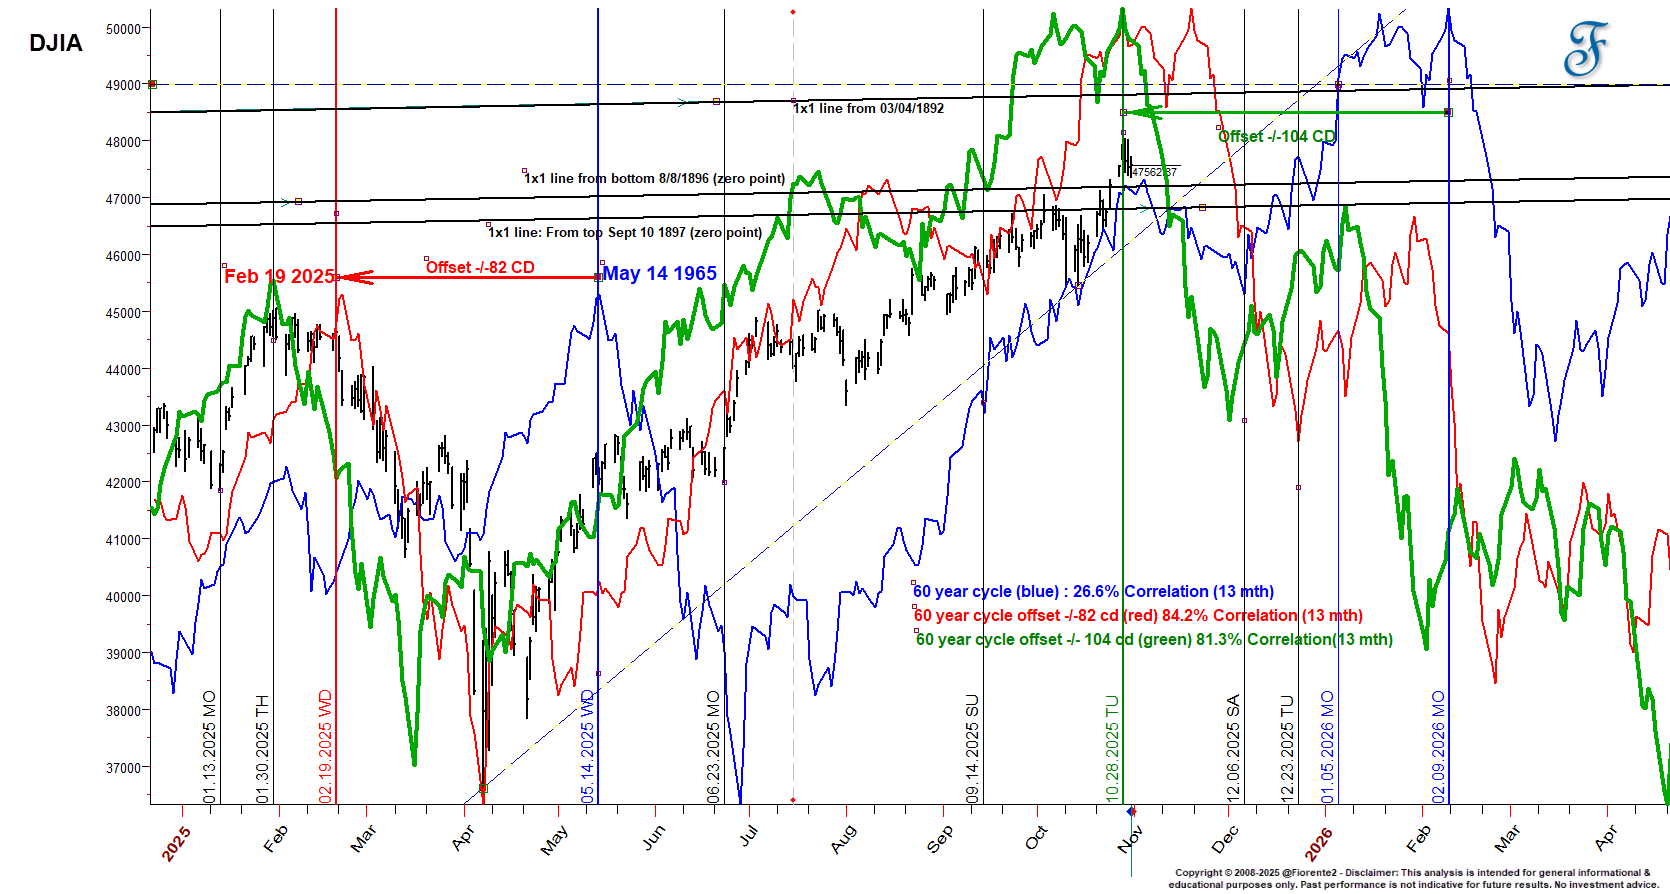
In the chart below, I have plotted three scenarios in which the 60-year cycle could unfold from our current position. The blue line represents the 60-year analog, while the other lines are offset to show a comparison and a remarkable 80% fit with today’s market.
Themes in society often repeat every 60 years. You can observe this in fashion, art, music, the stock market, and many other areas of life. Sixty years ago, automation made significant progress in society, and today, we are seeing the next step in automation through artificial intelligence.
It was striking that the decline in May-June 1965 was triggered by unexpected levies to be introduced, and that 60 years later, but 82 days earlier, the same tariffs came into focus again. So, I am tracking this offset (red line) and the 104-day offset (green line), both of which have an 80% correlation with the current stock market. This presents three scenarios in which the stock market could evolve along the 60-year cycle. See my footnote1
These cycle variations could signal a higher chance of a more range-bound move, similar to what we observed 4 years ago during the final phase of the trend before the early 2022 high. With Mercury, Jupiter, Saturn, and Uranus in retrograde over the coming months, a range-bound movement might become more apparent. This does not mean declines may be limited to minor moves.
More than a year ago, in May 2024, when we broke the 40,000 level on the DJIA, I forecasted that the DJIA might reach 49,000 by the end of 2025 or 2026. I made this forecast back in 2009, repeated it over the past few years, and included it again in November 2024 in my Stock Market Outlook 2025 on page 9. Today, we are not far off this target. My readers who study the W.D. Gann analysis methods may recognize what he mentioned on the number 49 as a cycle related to panics.
The almost horizontal 1x1 timing lines on the top of the first chart show that the 49,000 level from the low of March 1892 (after 49,000 calendar days) could be reached by May 2026. There may be other highs and lows from the past on which the DJIA could square out in price and time, but when time and price are in balance, it could signal a change in trend.
The 18.6-year business cycle
A May 2026 high may fit the 18.6-year cycle of the Lunar North Node. In his days (1909), W.D. Gann mentioned that these cycles were his greatest discovery. In his Financial Time table, he simulates the 18.6-year cycle by using alternate 18- or 19-year cycles between the years in the table below (which I extended into the future). Three Lunar node Cycles equal the important 55/56-year business cycle.
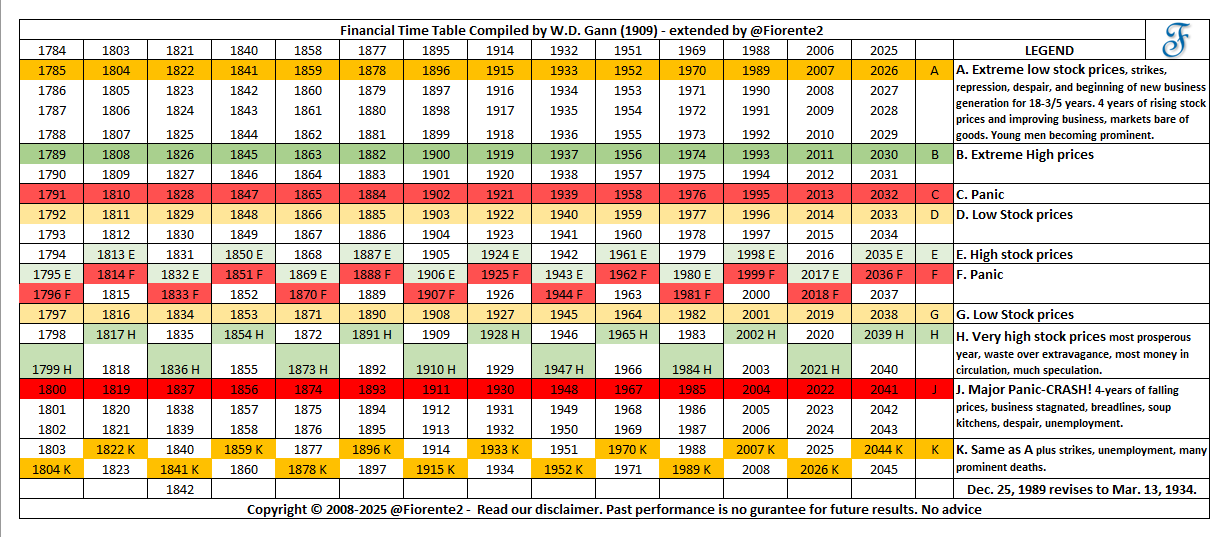
Louise McWhirther, a contemporary of W.D. Gann, also recognized the Lunar North Node cycle as an important business cycle. Read her “Theory of Stock Market Forecasting”.
This cycle does not always repeat exactly, as noted in the table above. October 2007 was at the end of a long-term uptrend. This may have been caused by favorable long-term cycles. The extreme low stock prices had not been reached before March 2009, but still within the table (A) section defined by W.D. Gann.
As many long-term cycles are making favorable aspects, such as the Saturn-Jupiter trine (within 1 degree), the Uranus-Neptune, and the Saturn-Uranus sextiles, we may see a high in the stock market at any time between now and mid-April to early May 2026. At this time, the North Node will reach a point in time that also coincides with the October 2007 high. Note: long-term cycles move slowly, hence it will take time before they turn over.
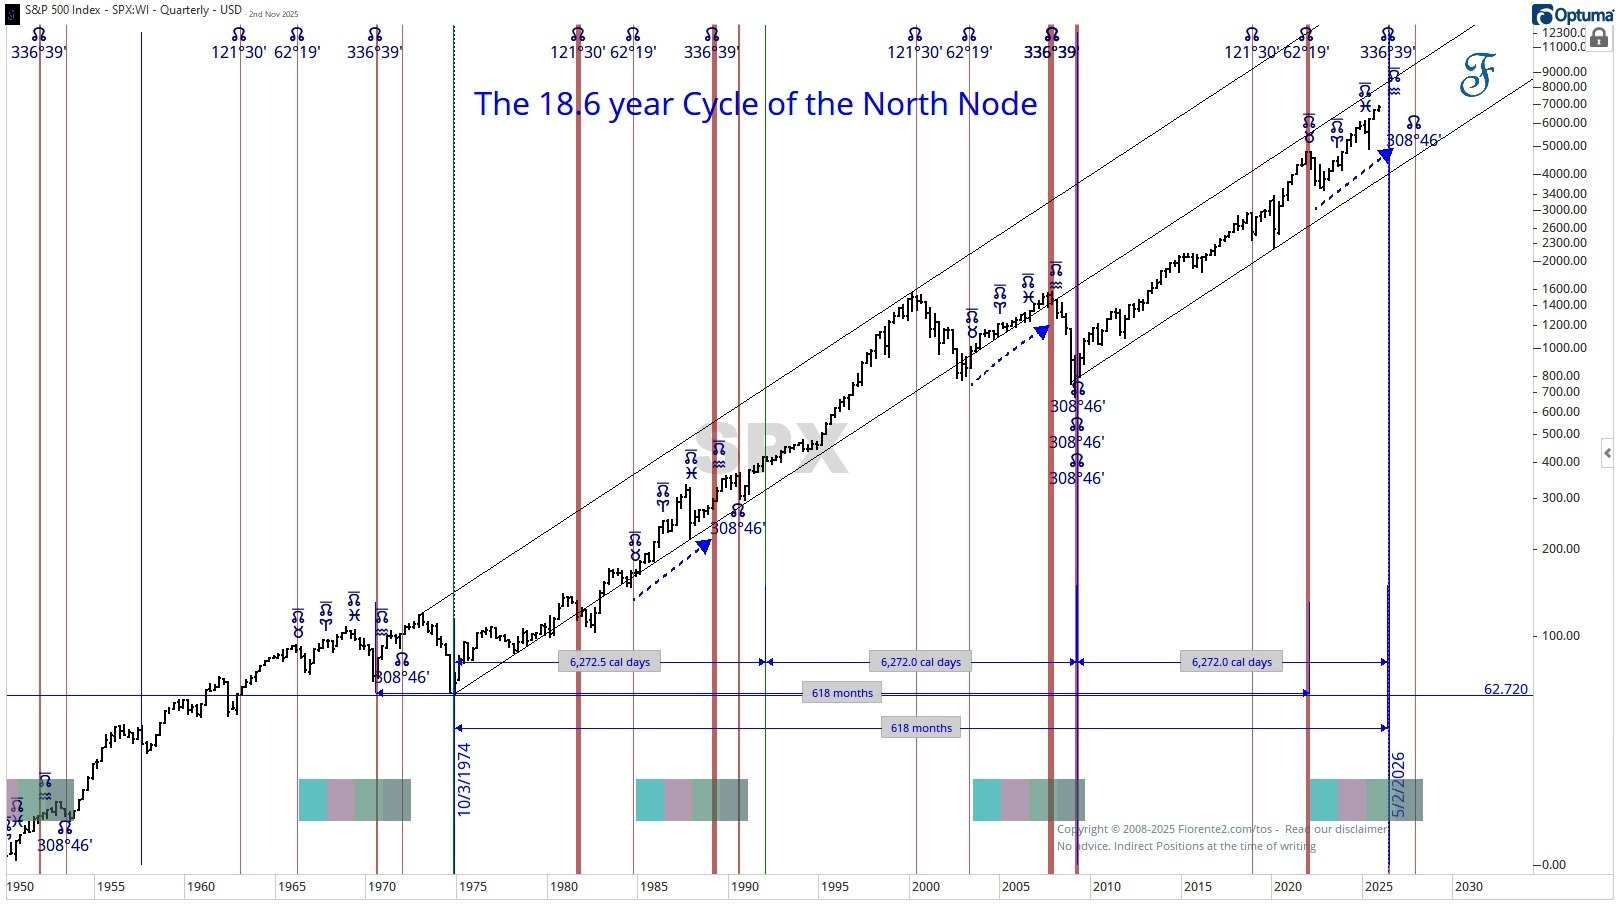
Note the sequence of 618 months, 1000 times a Fibonacci ratio of 0.618 between important highs and lows. Three equidistant lines of 100 times around the low of October 1974 (62.27) arrive at the same time target of mid-April to early May 2026.
You can see in the charts below how this may play out if the last cycle repeats.
The North Node in April-May 2026 aligns with the stock market high in October 2007. It is always possible that, at the very end, this point in time may turn into a panic low.

The October 2027 potential low aligns with the North Node’s position in March 2009.
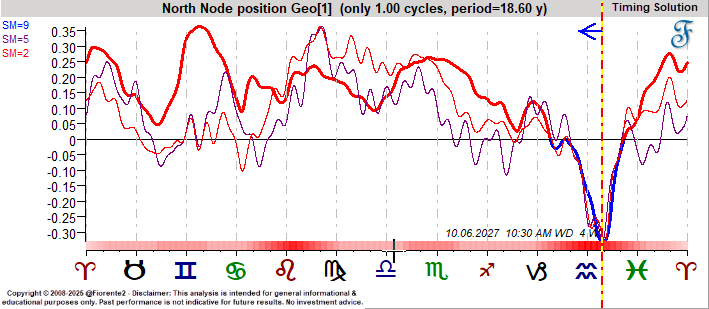
Note that the North Node is almost always in Retrograde motion, so it moves in the direction of the arrow (to the left) as indicated in the chart.
Conclusion
In today’s analysis, I have revisited long-term business cycles such as the Saturn-Neptune cycle, the 120- and 60-year cycle, the 18.6-year cycle, the 4-year cycle, and the possible influences in the context of today’s stock market highs. This is my bias for now. Always keep in mind that cycles can contract, extend, or invert, and anomalies can arise. So, be careful out there. No advice.
In case you haven’t noticed, I recently posted some extra charts in the Substack notes. You can find them all here.
P.S.: Occasionally, I share new analyses exclusively for free subscribers. Subscribing gives you email updates on these posts, plus extra insights and deeper research from the time you join onward; past analyses are not included.
If you liked this post from @Fiorente2’s Blog, why not restack and share it?
© 2008–2025 Fiorente2.com. All Rights Reserved.
Disclaimer: This analysis is for informational and educational purposes only and should not be considered investment advice. Read our full disclaimer.
Disclosure: From time to time, I may hold positions in the securities mentioned.
Footnote: that the overlay of these cycles do not represent a price forecast. Using analogs, I usually focus on similar crests and troughs in time, as cycles can contract, extend, or even invert.