
Kicking Off 2026 – Will 2026 defy the odds?
#286 The Sixth-Year Itch: A Forecast for US Indices in 2026

Introduction
From January 2 to January 8, the Dow Jones Industrial Average (DJIA) closed 2.6% higher than its starting point. Historically, this trend in the first 5 trading days has occurred 29 times in the DJIA’s 140-year history, with 20 of those years resulting in an annual rise. This gives a success rate of 69%. Will 2026 defy the odds?
On average, prices increase in 65% of the analyzed years (91 out of 140). While this year’s 69% success rate is slightly above the historical average, the difference is not statistically significant. This 4-point advantage looks promising, but could easily be random noise due to the small sample size.
The state of the U.S. economy
From an economic perspective, the US economy remains resilient.
The unemployment rate is still in its mid-4’s - around 4.4–4.5%, but analysts see this not as worsening but consistent with still a relatively tight job market. Forecasts from major banks still see real GDP growth between 2.2–2.5% in 2026. Core Inflation (without energy and food) seems to remain under control at 2.6%.
Last year, the economy managed to withstand most of the 2025 tariff increases imposed by the current US administration. The burden was largely absorbed by companies, with only a portion passed on to consumers.
Moving forward, I am unsure whether US companies will continue to absorb these higher costs in 2026 or fully pass them on to consumers.
With fiscal stimuli set to take effect, consumers may still be able to bear the burden without significantly cutting back on spending. With the big, beautiful bill coming into effect, the government is also spending trillions of US dollars to boost the economy even further. Therefore, from this perspective, 2026 looks very promising.
The overall Shiller S&P 500 Price-Earnings Ratio, currently around 38, is still below the year 2000 average of around 44.
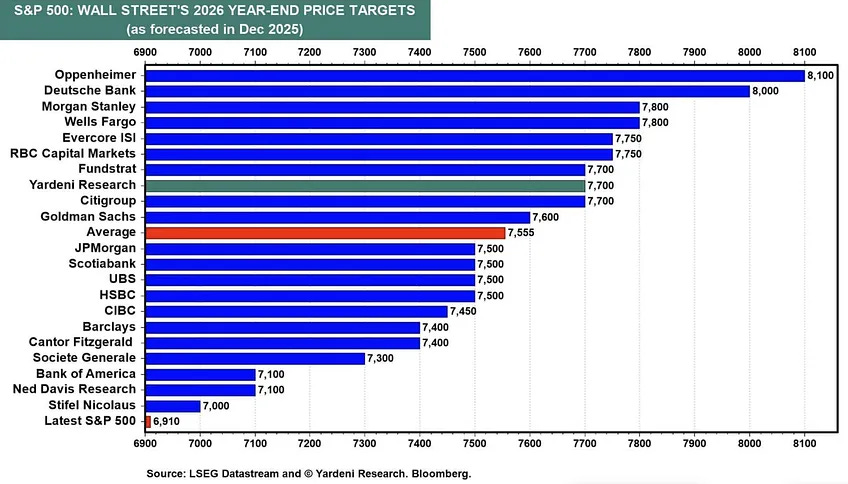
Most US bank forecasts have included this and other economic indicators in their projections. As shown in the overview below (HT: Maverick Equity Research ), they remain optimistic.
However, given historical cycles, I am not very convinced the US stock market will continue to rise this year.
The Historical Cycles View
Let’s look into the main long-term cycles that may define the trend:
The 60-year cycle (3x the Jupiter-Saturn cycle)
The 22-year solar cycle
The 19.86-year Jupiter-Saturn cycle (1/3 of 60-year cycle)
The McWhirter 18.6-year cycle of the North Node
The “sixth-year itch” – midterm elections
In the chart below, I have plotted the 60-year, 22-year, 19.86 Jupiter-Saturn Cycle and the Saturn-Neptune cycle.
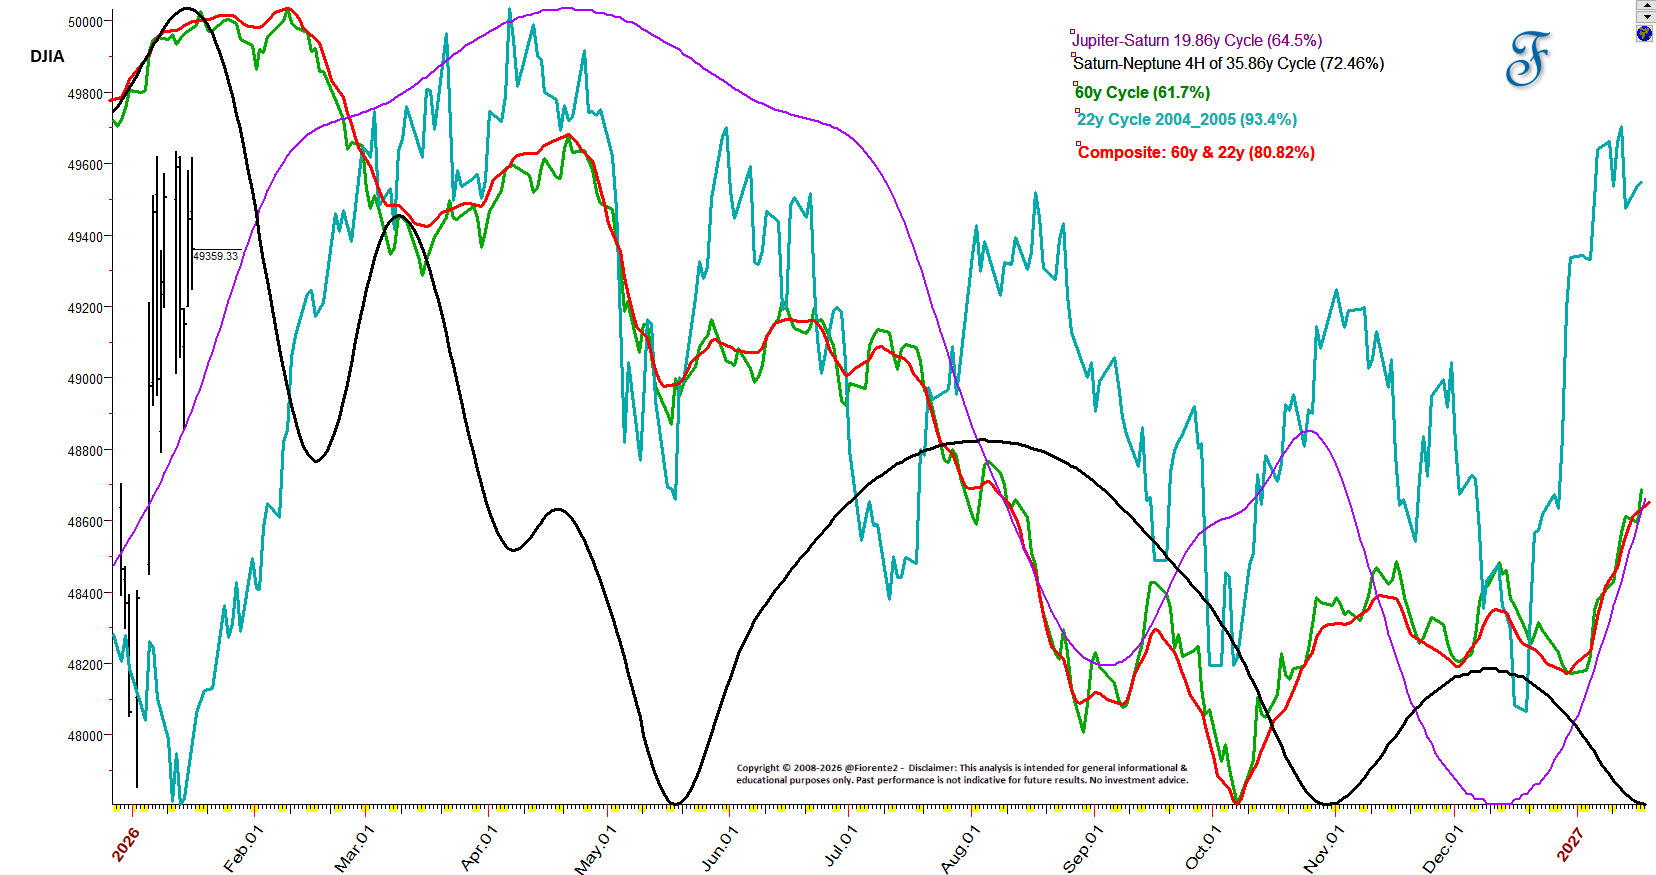
22-year solar cycle
The 22-year cycle is a solar cycle twice the 11-year sunspot cycle, which seems to have reached its peak in late 2025. A low number of sunspots is expected over the next 5 to 6 years and often aligns with recessions. Looking back a little more than 22-years (22.14 years or 8090 days), the 2004 to 2005 forecast in the above chart shows a decline into the end of the year.
McWhirter 18.6-year cycle
The McWhirter 18.6-year cycle of the Moon’s North Node (grey) seems to head in a similar direction to the 22-year and 60-year cycles, as seen in the chart below.
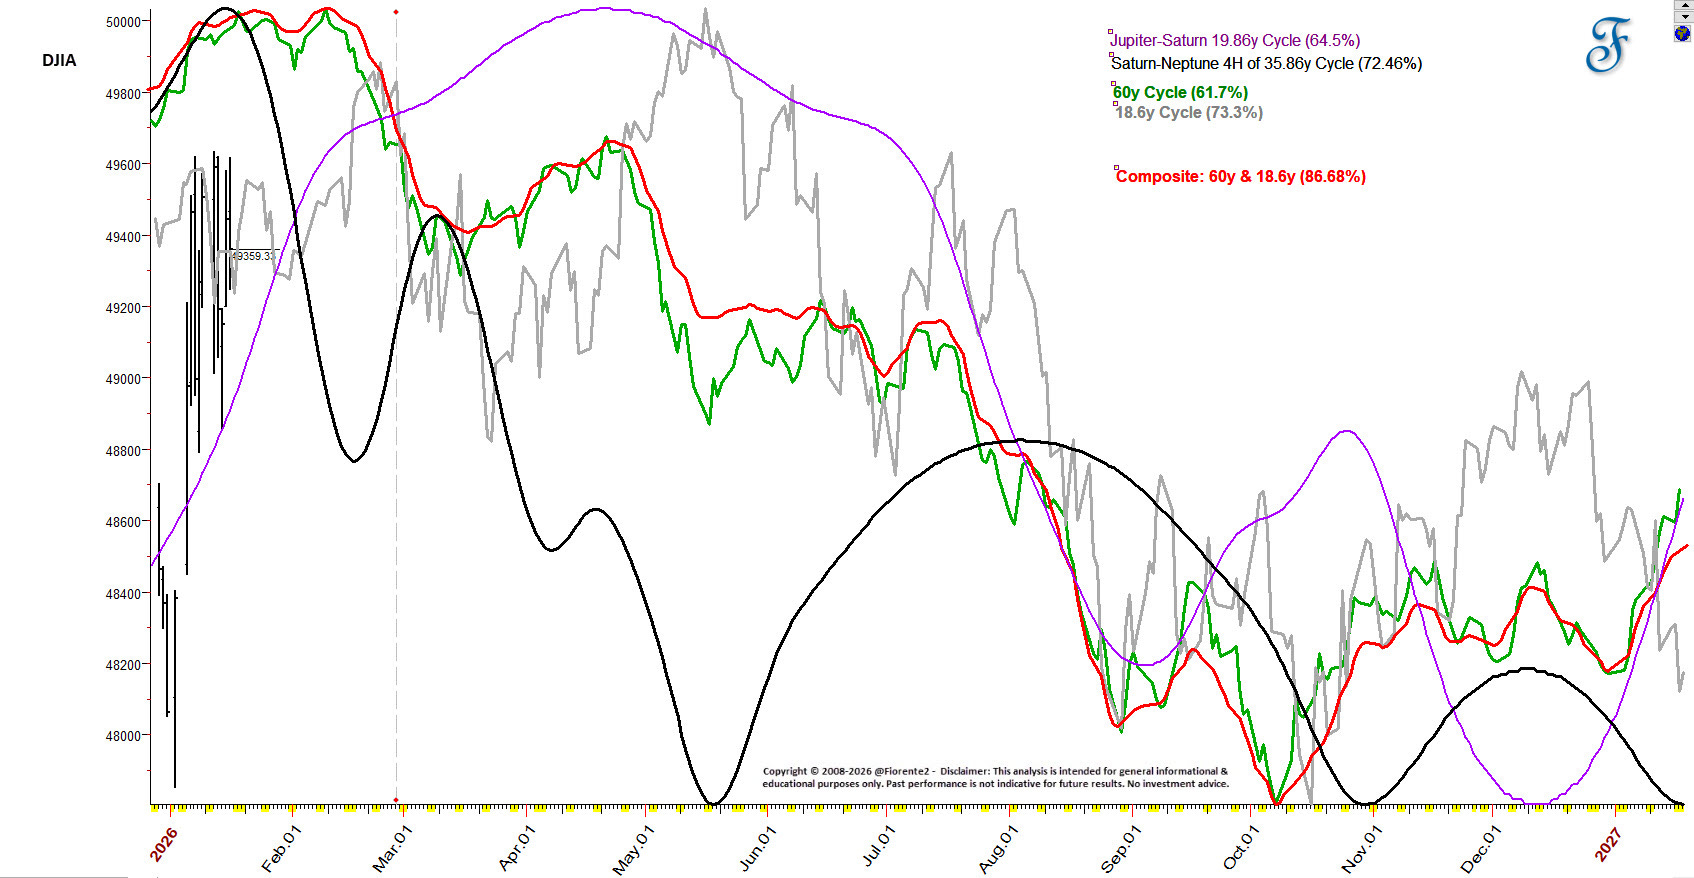
The Saturn and Neptune almost 36-year cycle has a conjunction on February 20th, 2026, just within 10 days after the 60-year expected high.
On average, the Jupiter-Saturn cycle has a wide range, up to the middle of May 2026, to turn over into a more bearish mode.
We are dealing with the probability that these cycles converge to a high. This could be anywhere between January and May 2026.
The US Midterm Congressional Elections
The US midterm congressional elections may not give a different perspective on the year 2026 forecast for the DJIA. In almost all midterm congressional elections, and particularly in the second midterm of a two-term presidency, it is an electoral nightmare for the governing party in the White House. This is called the “6th-year’s itch” Note: This is D. Trump’s second mid-term election, although not consecutive.
In 1966, 60 years ago, the midterm elections were a disaster for the Democrats in the White House, with a major sweep to the Republican Party. Something similar could happen this time, with the Democrats gaining back seats from the Republicans. Note: It will be an anomaly, as during the Bill Clinton era, Republicans will face limited losses.
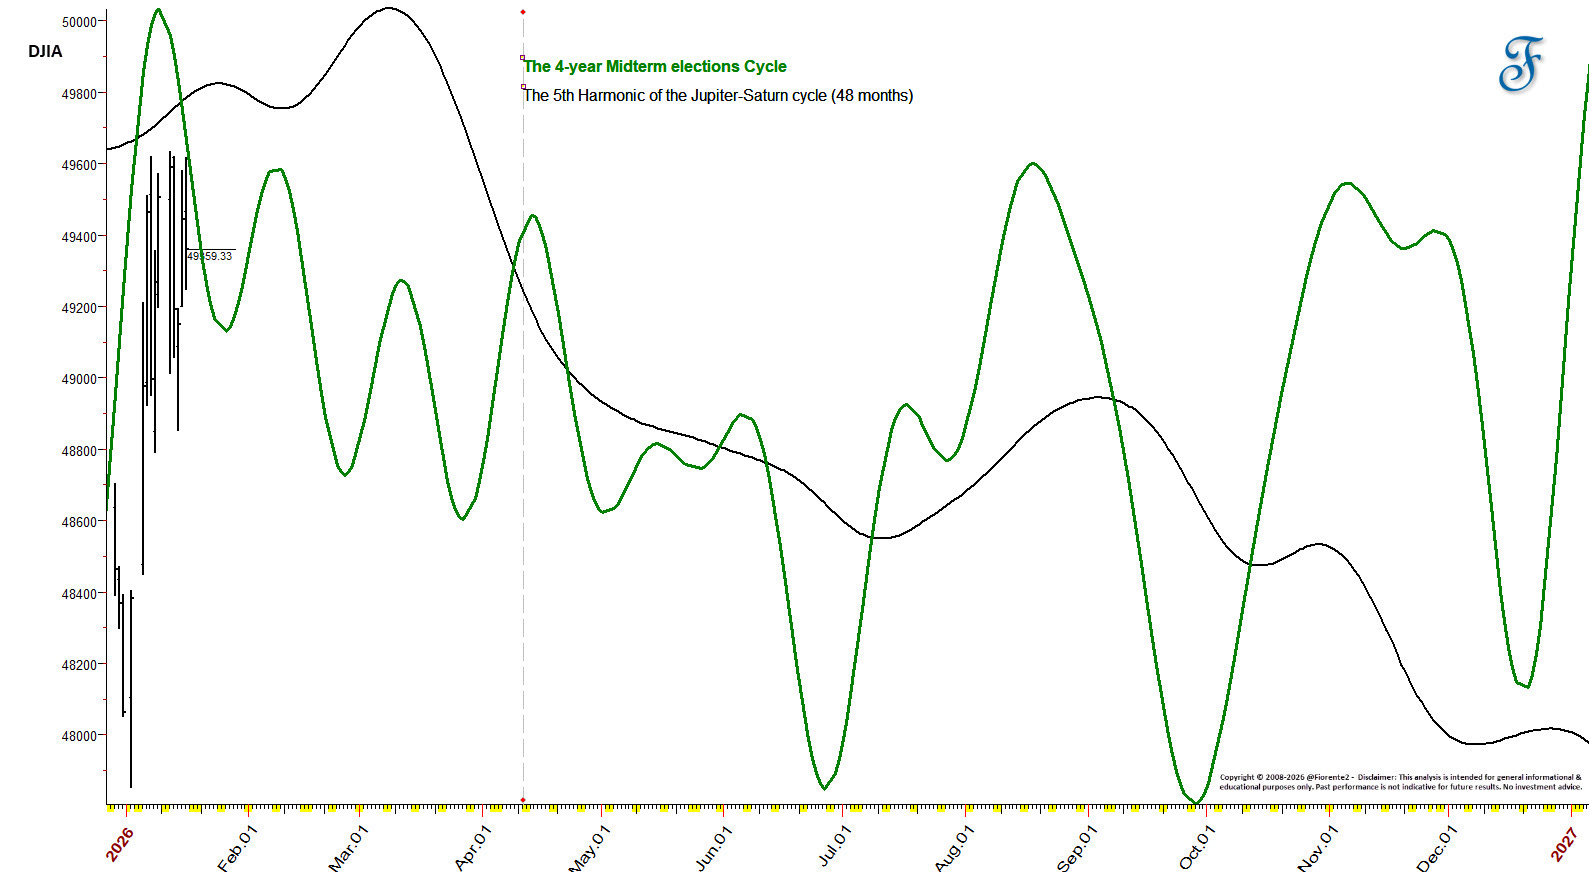
I have added a 48-month, 5th Harmonic of the Jupiter-Saturn Cycle (black in the above chart). Hence, the 4-year cycle is pointing downwards for the full year as well.
Looking at shorter cycles like the 18-month cycle, which aligned with the April 7th, 2025, low, the 18-month cycle is expected to make a low around October 2026. More on the shorter-term cycles in my next post.
Important: the above cycle chart overlays do not imply price forecasts. Time is more important than price.
DJIA 2026 Forecast
My price target for the DJIA, if it continues to follow the 60-year cycle, may indicate a potential 22% decline by the end of 2026, as shown in the chart below.
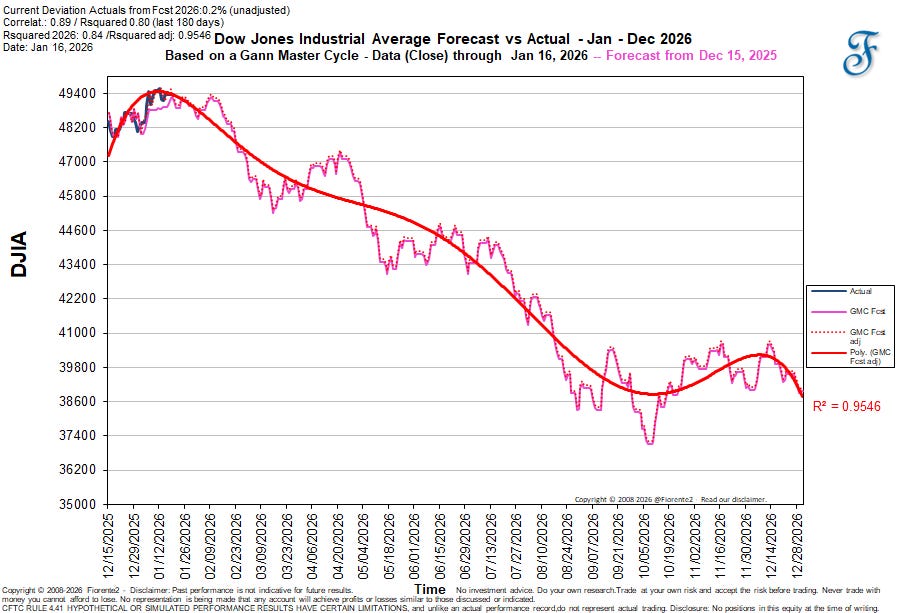
So far in 2026, the DJIA followed the 60-year cycle forecast. Going forward, the inflection points could well deviate from the forecast, which is based on this cycle’s past behavior. From time to time, inversions can occur. This forecast will dynamically adjust on a day-by-day basis once more data becomes available. I will update this frequently.
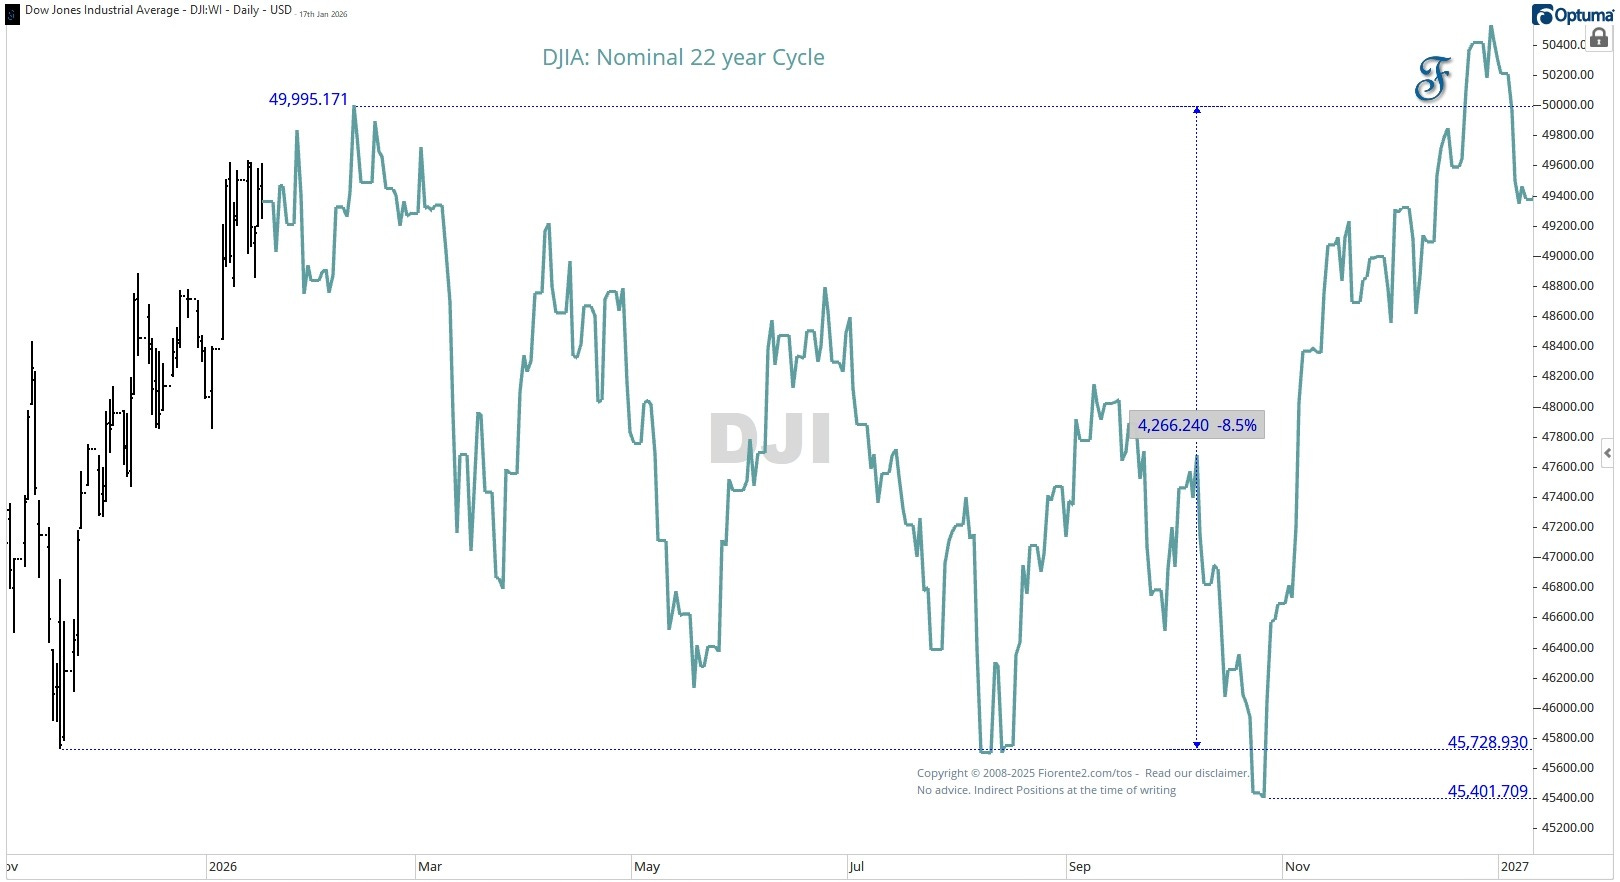
The nominal 22-year cycle forecast, using the exact calendar days (8036 days), however, shows a milder 8.5% to 10% decline by the end of the year if the DJIA continues to follow this 2004-2005 anomaly.
Conclusion
From a fundamental point of view, the economy still looks very resilient, although the average Shiller PE for the S&P 500 is nearing the historic high set in 2000 during the dotcom bubble. With all the fiscal stimulus and increased government spending to boost the US economy, a downturn in the US Indices may be limited.
The major planetary cycles discussed show an overall decline for 2026. The nominal 60-year and 22-year time cycles discussed in the above analysis show a similar direction, but the 22-year cycle has a much smaller decline than the 60-year cycle based on its past cycles.
The 4-year midterm election cycle shows a decline as well. As mentioned before, we are dealing with the probability that these cycles converge to a high between January and May 2026, followed by a subsequent decline by the end of the year.
With major economic stimuli, the potential threat of new tariffs, and the recent international turmoil over Venezuela and Greenland, 2026 is already unlike any year in history.
Hence, the actual outcome may well differ from my forecasts. In any case, I expect the year 2026 to be volatile for the overall US stock market. I will continue to follow these cycles in the months to come. Stay tuned
This is my bias for now. Always keep in mind that cycles can contract, extend, or invert, and anomalies can arise. So, be careful out there. No advice.
In case you haven’t noticed, I recently posted some extra charts in the Substack notes. You can find them all here.
P.S.: Occasionally, I share new analyses exclusively for free subscribers. Subscribing gives you email updates on these posts, plus extra insights and deeper research from the time you join onward; past analyses are not included.
If you liked this post from @Fiorente2’s Blog, why not restack and share it?
© 2008–2026 Fiorente2.com. All Rights Reserved.
Disclaimer: This analysis is for informational and educational purposes only and should not be considered investment advice. Read our full disclaimer.
Disclosure: From time to time, I may hold positions in the securities mentioned.