

Introduction
Recently Olga Morales posted on X (formerly Twitter) a chart with planetary lines on which Bitcoin trades and pointed to a Gann quote, that bottoms become tops and tops become bottoms. I remember that line as it came straight from the Stock Market Course (1955) where a rally to an old bottom is a short sale “because bottoms become tops and tops become bottoms”. This is Gann’s support-and-resistance rule. You can plot planetary lines to plot these support-and-resistance lines, or calculate the most important lines using a hexagon.
Since we have hit a $60K floor several times, this is a good moment for an update on Bitcoin. I will use a hexagon grid as I can plot both price and time using the same method.
In a recent post (#315), I have introduced Gann’s theory around the hexagon or cube.1 In the post today on Bitcoin I will plot the hexagon corners in time and corresponding price levels, which may show that using a hexagon chart or grid can be a good tool in analyzing an equity like Bitcoin.
The Hexagon Grid
In the hexagon grid I overlaid on Bitcoin (see chart 1), I have calculated the hexagon corners in time using a start date of April 7th, 2025, which was a remarkable and important date in time in many financial markets. The past vertical lines are plotted in gray, 60 degrees apart. The future and yet to come dates are plotted in dotted blue vertical lines, and follow the same logic.
For price I have divided the hexagon calculation into equal parts of 90 degrees in price. Note that each 90 degree level on the Bitcoin chart, plotted from 1 onwards, has given good support and resistance levels so far. You can clearly see that when the price level increases, the steps between each following level widen.
Where price and time meet, these often become inflection points, where the trend can continue or revert. The 90 degree price level increments are important levels, as you know. In a building, a 90 degree angle is a hard angle to break.
Did Bitcoin find a potential floor
Recently Bitcoin has twice traveled a 360-degree price level from last year’s October top. The 60K price level has been touched three times so far.
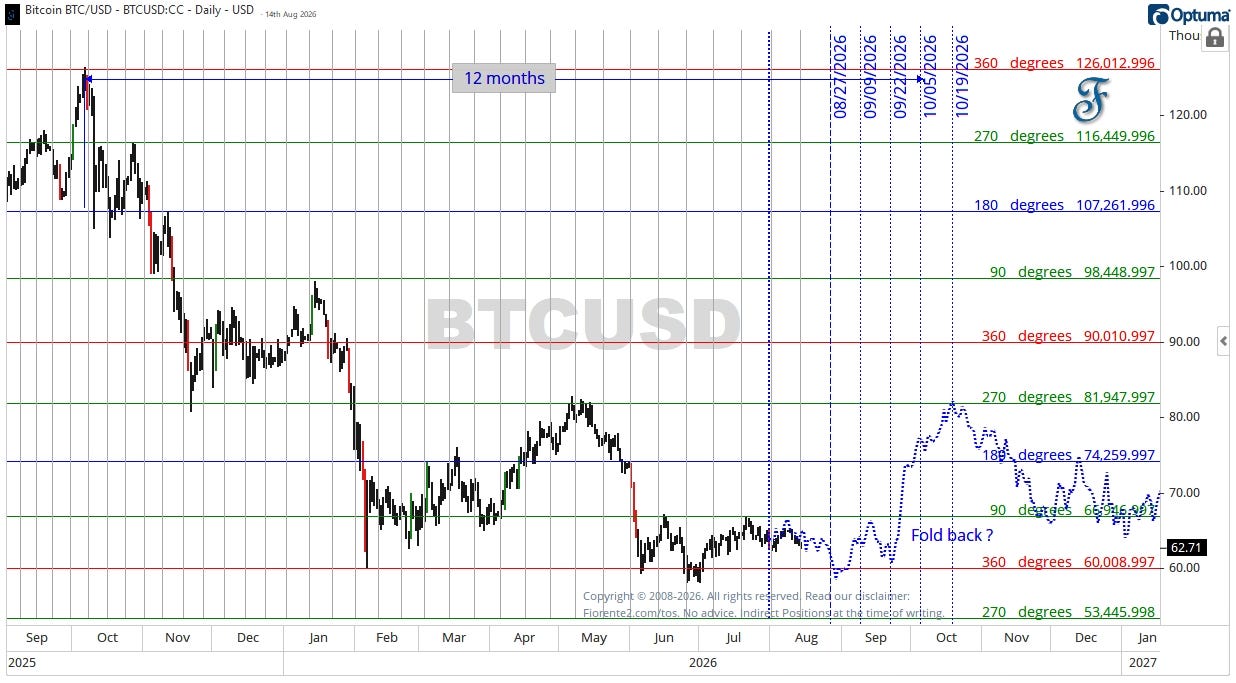
In my recent post in June (#312), I expected Bitcoin to find support at a $54K price level, into a June-October time window. The August 1 Mars-Uranus date I flagged there has passed, with Bitcoin still near $62K, so my lower target is still open. Currently, Bitcoin is trading between the $60K and $66K price levels and neither of them has been broken. This sideways move can continue for some time, and when broken the next higher or lower price level may come into the picture.
The foldback pattern drawn at the end of July is my bias for now, but as written many times before, a foldback pattern may cease to function any further at some point in time.
You may recall what Gann wrote about support-and-resistance lines.
“It is safe to buy when a stock reacts to old tops the first, second, or third time, but when it declines to the same level the fourth time, it is dangerous to buy as it nearly always goes lower” (Gann, Stock Market Course, 1955).
This works for bottoms as well. So, despite the foldback scenario, pointing at a more positive forecast for Bitcoin, I have not yet abandoned my June Bitcoin forecast to trade lower to the $54K level.
Conclusion
When Bitcoin falls through the $60K level from above, I expect BTCUSD may continue its down trend to a $53K-$54K price level, probably by early October 2026. On the other hand, a push through the $66K level may bring Bitcoin back toward $74K and the $81K-$82K zone, where the May 2026 high and the 270 degree hexagon level line up.
Remember, cycles can contract, extend, and invert. I have no crystal ball, and a hexagon grid only maps the ground. Always watch the chart in front of you. Be careful out there. No advice.
If you liked this post from @Fiorente2’s Blog, why not restack and share it?
© 2008–2026 Fiorente2.com. All Rights Reserved.
Disclaimer: This analysis is for informational and educational purposes only and should not be considered investment advice. Read our full disclaimer.
Disclosure: From time to time, I may hold positions in the securities mentioned.
“The cube or hexagon proves exactly the law which works because of time and space in the market. When a building is put up it is built according to a square or hexagon. It has four walls or four sides, a bottom and a top; therefore, it is a cube” (Gann, Stock Market Course, 1955).