
Bitcoin: Inside the 4-Year Low Window
#312 | Quick update. The January foldback call, and where the 4-year cycle low stands now.

Introduction
In my January 18, 2026 post “The Moment Of Truth For Bitcoin II”, I set a bias that Bitcoin would follow the 4-year cycle down toward roughly $54,000 between June and October 2026, with a foldback off the winter high. That bias rests on two Mars-Uranus helio cycles, which I charted in that January post.
Bitcoin trades near $64,200 today, inside that window but above the target.
Where the cycle low stands
BTCUSD is approaching my target area around the Mars-Uranus conjunction of August 1, 2026.
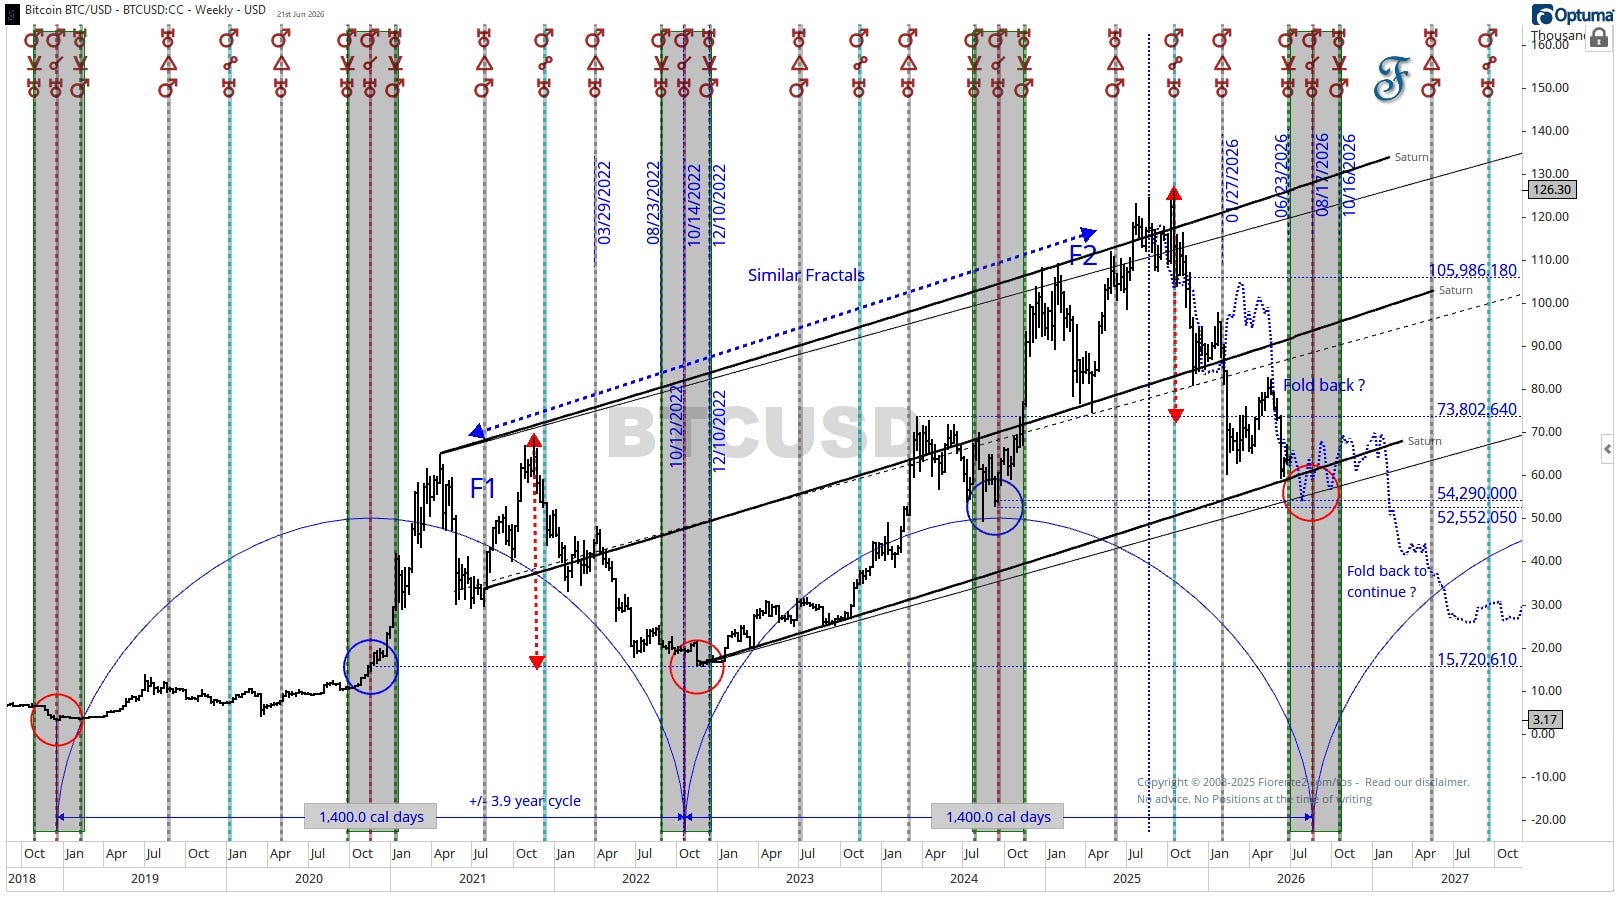
The semi-circles on the chart are two Mars-Uranus cycles: a 3.9-year cycle (almost 4 years), or about 1,400 calendar days. Two similar fractals, F1 into 2021 and F2 into 2025, have now almost folded back to the lower rising channel trendline.
Price near 64,237 sits below the 73,802 level overhead and above the target zone at 54,290 to 52,552. The window runs into mid-October, with the chart marking July 27, August 1, and October 16, 2026.
Continuation lower toward 54,290 needs the channel support to give way. One caveat to make: the 4-year low last turned on the Mars-Uranus helio aspect once, in November 2022. That is a single instance, too few to call a hit rate, so I watch the chart here, not the calendar.
A low around this time may not mark the end of the decline. The foldback fits a larger head-and-shoulders pattern that could unfold much lower, into the 30,000 level, after a sideways move into year-end.
A weekly close back above the 73,802 foldback level would invalidate the lower target and point higher.
Conclusion
Bitcoin is inside the June to October window at around 64,200, above the 54,290 to 52,552 target. Continuation needs the channel to break, and a weekly close back above 73,802 would invalidate it. The Mars-Uranus timing rests on one past instance, so I’m giving the chart more weight than the count.
This is my bias for now. (No advice.)
Remember, cycles can contract, extend, and invert. I may be wrong, of course. Anomalies can occur, fundamentals can shift, so be cautious.
In case you haven’t noticed, I post various charts in the Substack notes every week. You can find them all here. (click on the link)
P.S.: I’ll post the next Bitcoin update the moment the channel breaks toward the target. Subscribers get it by email from the day they join.
If you liked this post from @Fiorente2’s Blog, why not restack and share it?
© 2008–2026 Fiorente2.com. All Rights Reserved.
Disclaimer: This analysis is for informational and educational purposes only and should not be considered investment advice. Read our full disclaimer.
Disclosure: From time to time, I may hold positions in the securities mentioned.