

Introduction
BTCUSD dropped fiercely into the beginning of the Jupiter Retrograde period in mid-November 2025. This was most likely caused by the Venus-Pluto (Helio cycle), which BTCUSD has been mirroring since August 2025. As BTCUSD approached the Venus-Pluto conjunction on January 17th, 2026 and a new cycle started, we may be approaching the next Moment of Truth for Bitcoin.
Let’s review the various charts I posted earlier on November 9 and November 25th, 2025
Bitcoin - Weekly Log Chart
On Nov 9th, I posted the weekly chart below, on a log scale, I have drawn the long-term channel that Bitcoin (BTCUSD) is trading in.
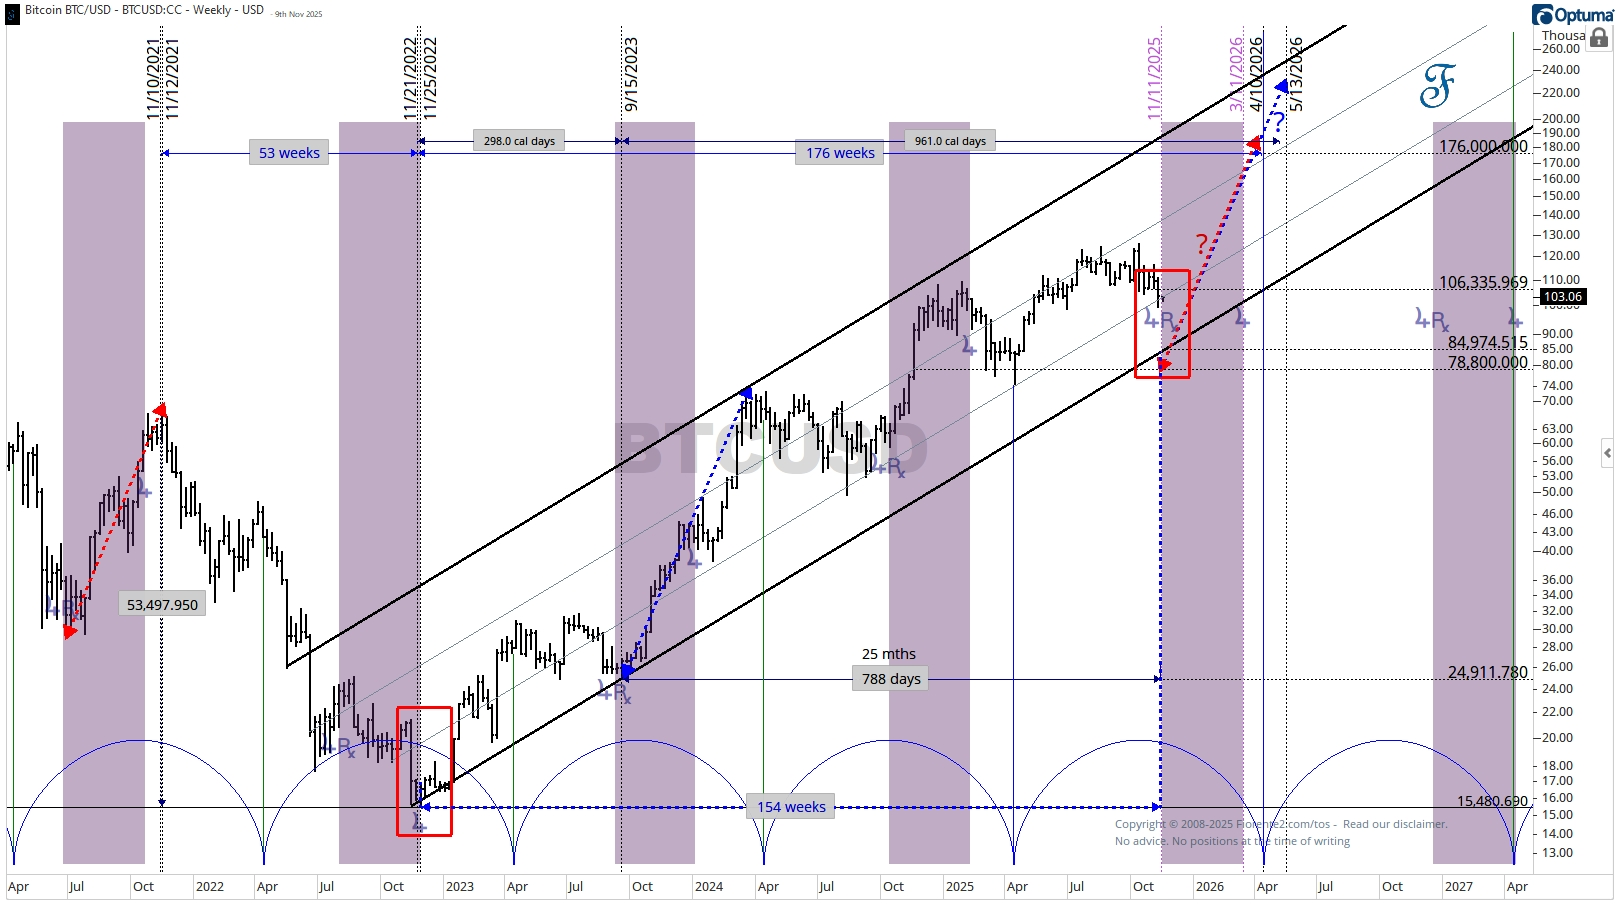
You can read the analysis here. (click on link)
The same updated chart, shown below, shows BTCUSD trading within the channel plotted on the chart.
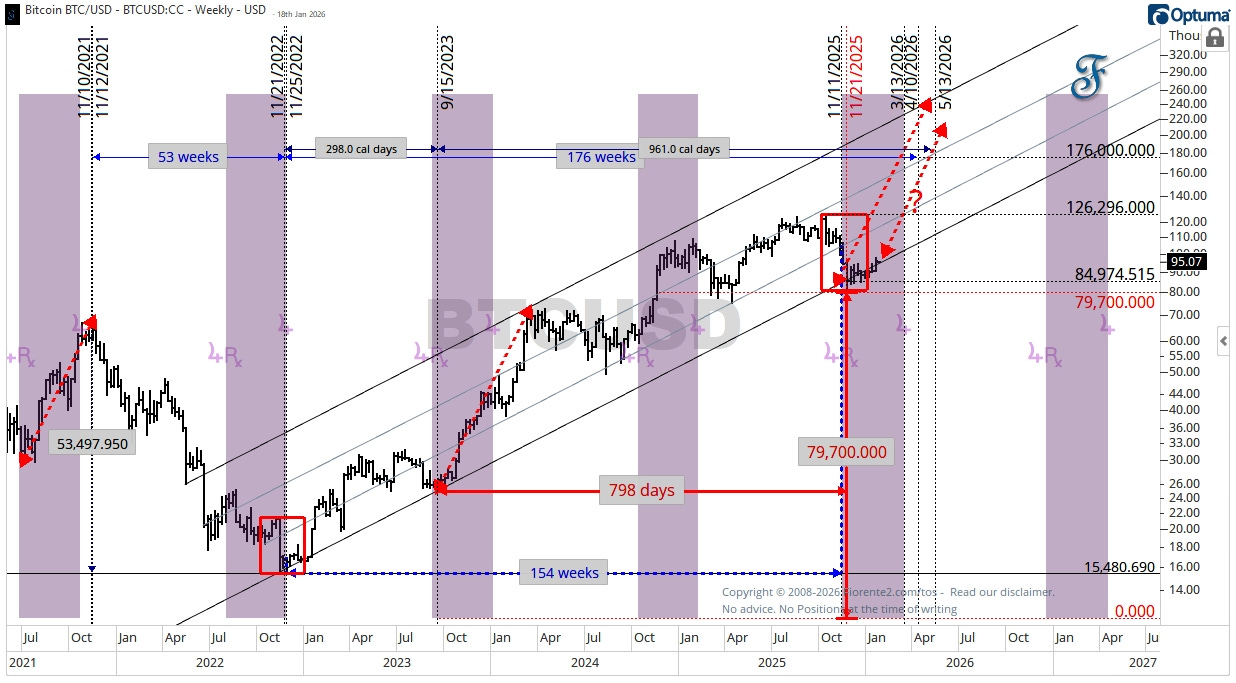
Aligning the low (15400) in time: 154 weeks was a good estimate for Bitcoin to find support. Bitcoin did not go as low as my price target of $79,700 in 798 days (meant to be 797 days), but that did not come from the (lower) and more important November 2022 low. As Gann learned: “Time is more important than Price”.
Although BTCUSD is trading near the lower trading channel, I’m not entirely convinced that the path will continue as indicated by the red dashed arrows, since Bitcoin has been following the Venus-Pluto Helio cycle in an almost perfect mirror image foldback since August 2025.
Venus Pluto (Helio) Cycle
My reservations are based on my analysis I posted back on November 24th, 2025. See the chart below. You will find the Substack note here. (click on the link.
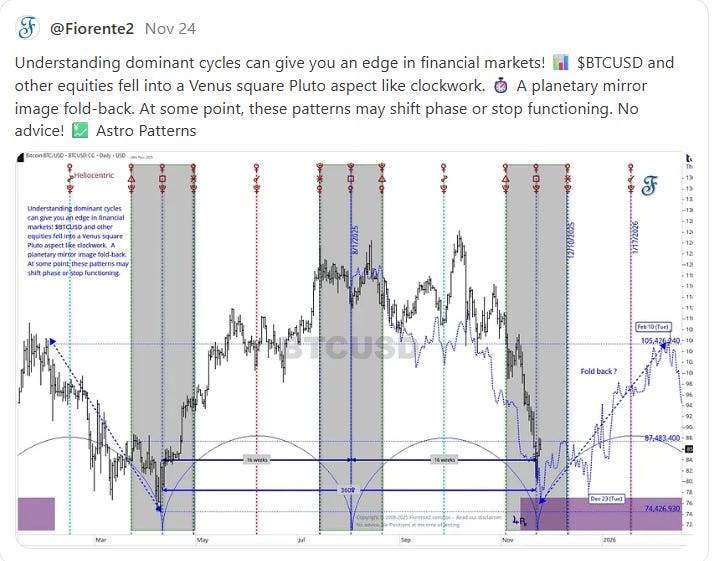
So far, BTCUSD has been following the Venus-Pluto Helio Cycle in a mirror image foldback, as you can see in the updated chart below.
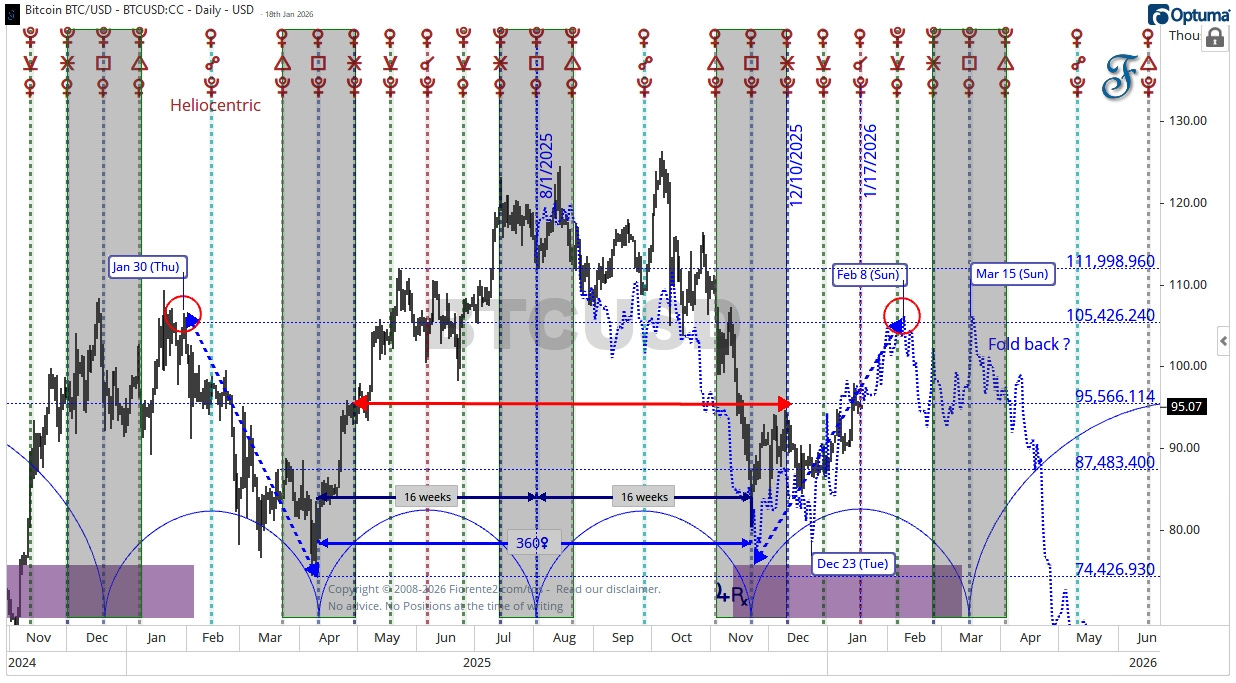
You can see in the above chart that every 180 degrees, Venus-Pluto helio, the trend changes (follow the half circles at the bottom of the chart). This is around the time the Jupiter Retrograde period will end (March 11th, 2026), just three days before Venus squares Pluto on March 15th, 2026.
The foldback may end on March 15th, with an inversion of the mirror image foldback, but this does not usually happens as you can see in the chart below.
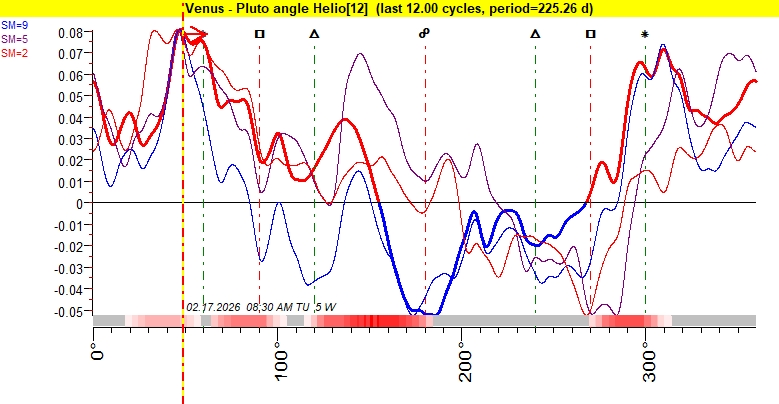
We are now at the Venus-Pluto heliocentric conjunction (0-degree separation, which is at the same degree). You can see that over the last 12 cycles, it may have given some downward pressure.
A recovery from this into February 17th, 2026, may be the next moment in truth after Venus and Pluto hit the 49-degree separation. There is a 60-70% chance this is a likely outcome.
You can see there are some variations over the last 2, 5, or 9 cycles. The foldback may end here, with a possibility after a first decline into a rebound into March 15th, 2026, around the Venus square Pluto aspect.
If the corrections end between February 17 and March 15th, 2026 (give it some leverage of 1-2 weeks on either side), the longer-term outlook may be bearish for Bitcoin.
Longer-Term Trend
The 4-year cycle low in Bitcoin is expected around June to October 2026. Last time this cycle in November 2022, turned around the Mars conjunct Uranus Helio aspect (at the same degree). I have circled these aspects in red.
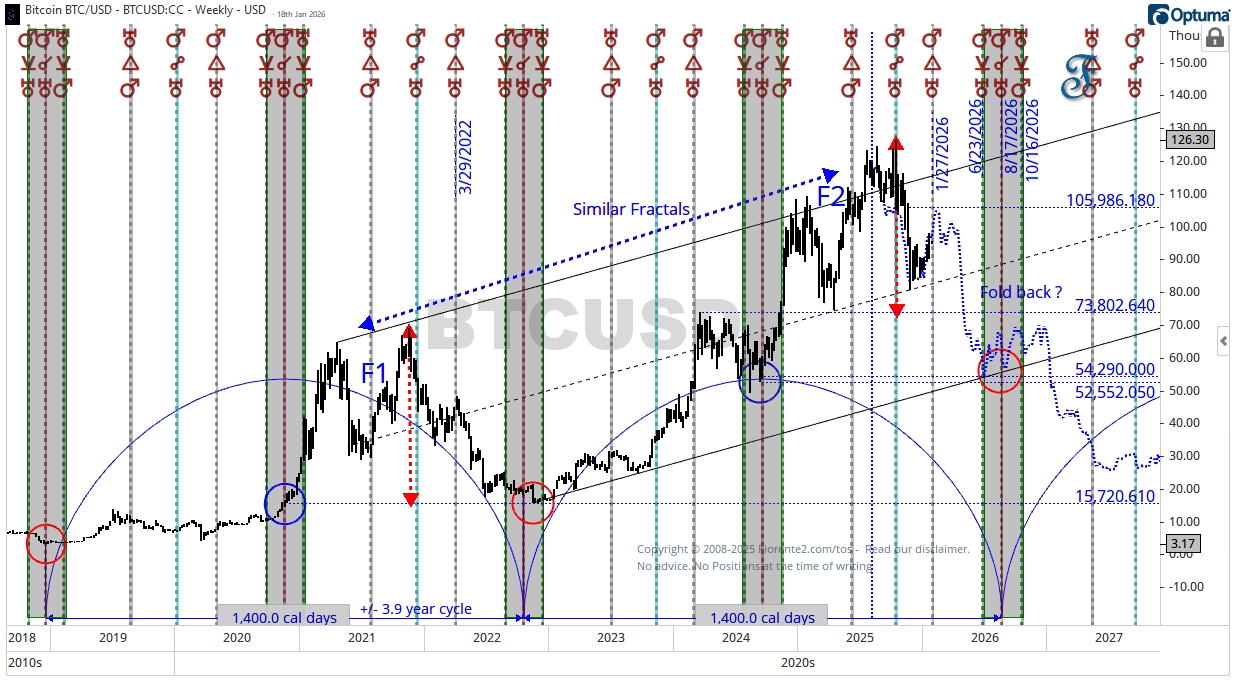
Moreover, you can see in the above chart that if the foldback continues as plotted, turning on the Mars trine Uranus aspect when Mars is at a 120-degree separation from Uranus (January 27th, 2026), a Head and Shoulders Pattern may emerge. This could bring Bitcoin back to the $54,000 price level, anywhere between June and October 2026.
Conclusion
Since August last year, Bitcoin has been folding back on the Venus-Pluto Helio cycle. We are now at the start of a new 225-day cycle following the Venus-Pluto heliocentric conjunction (January 17th, 2026), which could initially exert downward pressure.
Not soon afterwards, at the Mars trine Uranus Helio aspect on January 27th, 2026, a Head and Shoulders pattern may emerge, and these planetary aspects may add energy (Mars) and volatility (Uranus) for more downward pressure, or an up and down rangebound move until March 15th, when Venus squares Pluto.
Either way, my longer-term thoughts on Bitcoin have a bias that from January 17th to March 15th, 2026, Bitcoin will likely follow the 4-year cycle down to a probable $54,000 price level between June and October 2026, as shown on the 4-year cycle chart.
This is my bias for now. Remember, cycles can contract, extend, and invert.
In case you haven’t noticed, I recently posted various charts in the Substack notes. You can find them all here. (click on the link)
P.S.: Occasionally, I share new analyses exclusively for free subscribers. Subscribing gives you email updates on these posts, plus extra insights and deeper research from the time you join onward; past analyses are not included.
If you liked this post from @Fiorente2’s Blog, why not restack and share it?
© 2008–2026 Fiorente2.com. All Rights Reserved.
Disclaimer: This analysis is for informational and educational purposes only and should not be considered investment advice. Read our full disclaimer.
Disclosure: From time to time, I may hold positions in the securities mentioned.