

Introduction
Since the early October 2025 high, we have seen considerable volatility in the US indices, but so far they have shown resilience and are trading within a range similar to that observed four years ago at the end of 2021. We know what happened afterwards.
In my last update on the US Indices I discussed the various long-term cycles in the US Indices and I mentioned that it was possible to see a high in the stock market by February 1966, based on the 60 and 120-year cycles, but that cycle of the 18.6 year cycle of the Moon’s North Node could drag the US Indices into a high by mid-April to early May 2026.
The sixty-year cycle is an important cycle that is considered to be the most important cycle, as most of the planets which our weekdays are named after return to approximately the same position on the zodiac. Moreover:
Themes in society often repeat every 60 years. You can observe this in fashion, art, music, the stock market, and many other areas of life. Sixty years ago, automation made significant progress in society, and today, we are seeing the next step in automation through artificial intelligence.
So, let’s review where we are now on the 60-year cycle. Are we close to a square out in price and time on the 60-year cycle?
The 60-year Cycle (NYSE/DJIA)
I have updated two charts, which I showed earlier to my premium subscribers in the past, on the NYSE Composite Index and the DJIA
NYSE Composite Index
In the chart below, I have plotted a box around the quarterly chart of the 60-year chart of the NYSE Composite Index, which consists of all stocks listed on the New York Stock Exchange.
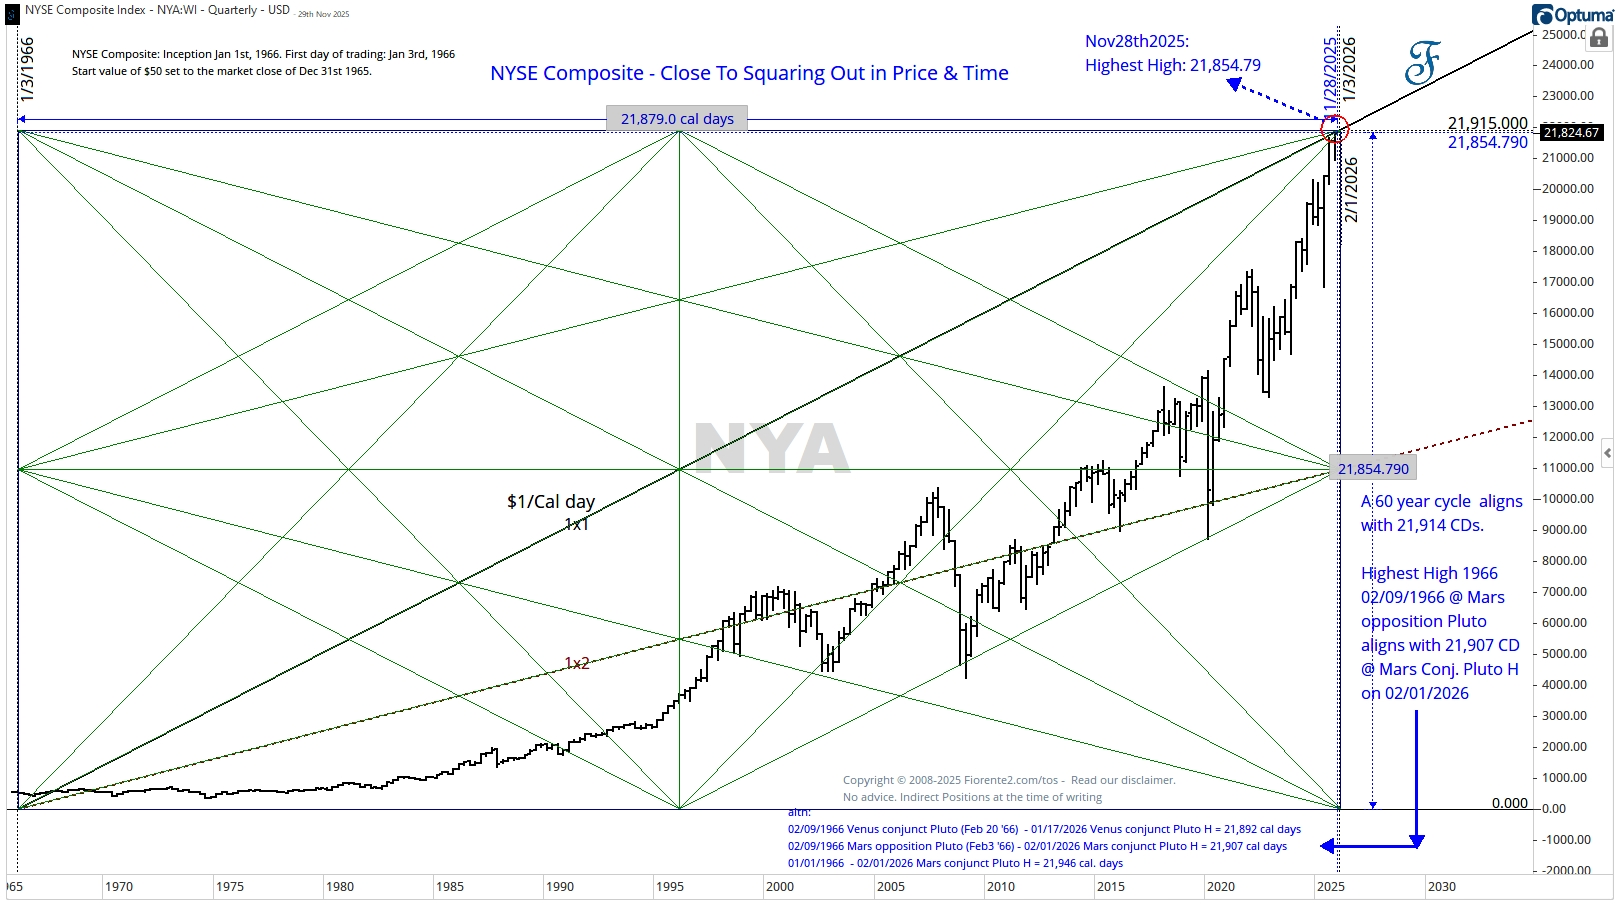
You can clearly see on the 1x1 line, which moves $1 per calendar day, that the NYSE Composite Index is close to a square out in Price and Time. The NYSE Composite Index started trading on January 3rd, 1966, almost 60 years (or 21,915 days) ago.
We may see the Index continue into early January 2026, towards the 21,915 price level, which would then be a perfect square in time.
However, reviewing the cycles during which the NYSE declined after its February 9th, 1966, high, the medium-term Venus/Mars-Pluto cycles may drive the market higher into early February 2026 as well. See my note in smaller caps and blue on the chart.
DJIA - 60-year cycle
In the chart below, I have plotted three scenarios in which the 60-year cycle could unfold from our current position. The blue line represents the 60-year analog.
Although the 60-year cycle in blue has only a 40% correlation, the adjusted cycles, aligned with todays today’s trend and offset by 82/104 calendar days, show a remarkable 80% or more fit with today’s market.
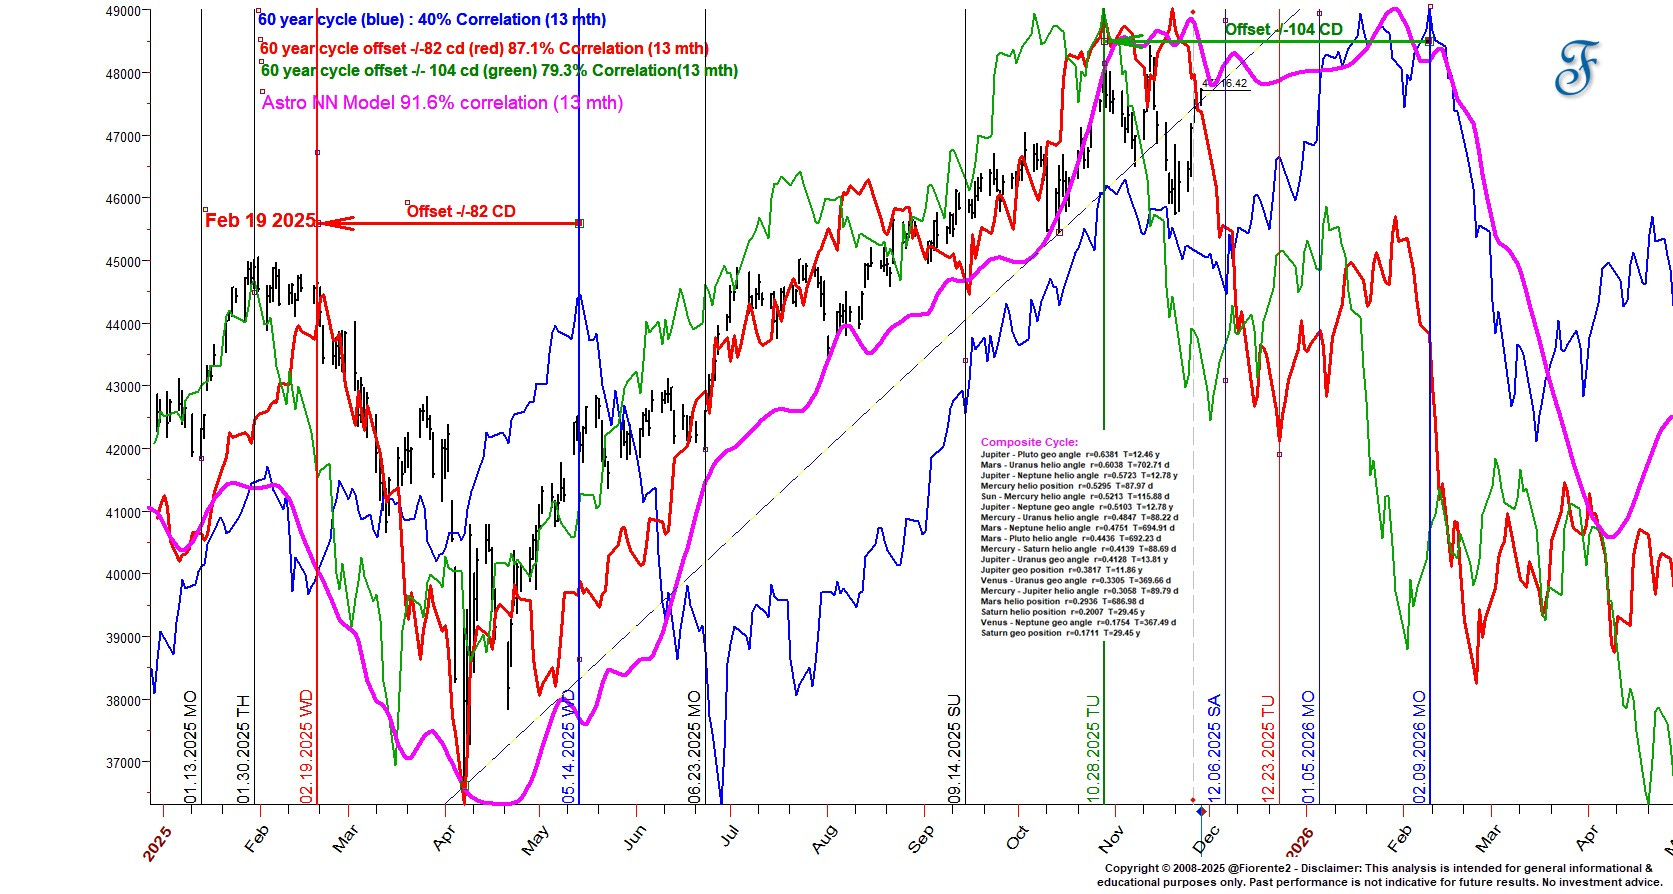
Note that in May 1966, the USA introduced new tariffs on imported cars, and in 2025, the current US Administration introduced similar tariffs, 82 days earlier. Offsetting the 60-year cycle high in February 1966 towards the end of October also fits well. A similar planetary pattern (involving some other cycles) was seen in the sky. Hence, I was not surprised the DJIA took a dive into November, see my footnote1
As mentioned last time, “these cycle variations could signal a higher chance of a more range-bound move, similar to what we observed 4 years ago during the final phase of the trend before the early 2022 high. With Mercury, Jupiter, Saturn, and Uranus in retrograde over the coming months, a range-bound movement might become more apparent.”
To illustrate the potential of a range-bound move, I will show you my new planetary model, which I tested with Neural Network software over the last 12 months. I plotted the Astronomy cycles, as a composite model in pink (Astro NN Model), on the above chart, and it continues to show a significant correlation (91.6%) with the DJIA path so far.
The probabilities of this model, based on past cycle performance, favor a rangebound move unto early February 2026. The range-bound move is most likely due to medium-term cycles.
The new Astro Model not only captures longer-term cycles but also includes medium-term cycles within the longer-term trend. It aligns with the 60-year cycle so far. I have printed these cycles in a note on the chart. You can click the chart to enlarge it.
Note: This does not mean the DJIA could not decline earlier or later, as cycles can contract, extend, or invert. We are dealing with probabilities, not certainties. Past stock market behavior does not always repeat with the same volatility at the same time.
Although I mentioned earlier that the 18.6-year cycle is expected to make its high by mid-April 2026 to early May 2026, it may come in earlier this time.
Conclusion
In today’s analysis, I have revisited the 60-year cycle on the NYSE Composite Index and the DJIA. The probabilities of the various 60-year cycles and the planetary composite model (pink) on the DJIA favor a potential topping phase into January to early February 2026. Similar charts could be made for the Nasdaq or the S&P 500, with slight variations in timing.
The medium-term cycles within the pink composite cycle on the DJIA also confirm the potential for a more range-bound move into early February 2026.
Whether the 18.6-year cycles come in at the expected time, as mentioned in my earlier post, is to be seen. This cycle can come in early as well, aligned with the 60-year cycle.
This is my bias for now. Always keep in mind that cycles can contract, extend, or invert, and anomalies can arise. So, be careful out there. No advice.
In case you haven’t noticed, I recently posted some extra charts in the Substack notes. You can find them all here.
P.S.: Occasionally, I share new analyses exclusively for free subscribers. Subscribing gives you email updates on these posts, plus extra insights and deeper research from the time you join onward; past analyses are not included.
If you liked this post from @Fiorente2’s Blog, why not restack and share it?
© 2008–2025 Fiorente2.com. All Rights Reserved.
Disclaimer: This analysis is for informational and educational purposes only and should not be considered investment advice. Read our full disclaimer.
Disclosure: From time to time, I may hold positions in the securities mentioned.
Footnote: that the overlay of these cycles do not represent a price forecast. Using analogs, I usually focus on similar crests and troughs in time, as cycles can contract, extend, or even invert.