

Introduction
In my article #303 “Wheels Within Wheels” I highlighted May 21st–22nd as a near-term hotspot and laid out two scenarios for the July 2nd–4th cycle window: a major low near 42,149, or an inversion where the DJIA clears its February resistance first and July marks a high instead. The signal to watch was whether the Dow pushed through 50,512.
On May 22nd it closed at 50,580. The inversion case has gained probability.
Three near-term macro events may add weight to that scenario. The June 17th Fed meeting is priced at 98% probability of no cut (CME FedWatch).
As I write this article, the US Government is reportedly working toward a framework deal with Iran that would reopen the Strait of Hormuz. And 2026 marks the 250th anniversary of American independence, July 4th the focal point.
Each of those conditions, on its own, reduces the near-term probability of an acute downside event. The inversion scenario has gained probability.
Last week the 60-year cycle’s correlation to 2026 dropped to r=0.22; well below the 2001 analog at r=0.84. The closest historical match to 2026 peaked last Thursday (21st).
Using a Mass Pressure model, which finds the nearest historical matches by pattern correlation across 125 years of DJIA data, shows 2001 as the strongest analog (r=0.84), running less than one index point from 2026 right now.
In 2001, the path from this point turned lower through the second half of the year. These two frameworks are pointing to the same stretch of a probable forecast from different starting points.
What Mass Pressure measures
A Mass Pressure model is a cumulative return model that resets to 100 on January 1 each year. As the year progresses, the actual percentage move is measured against the start of the year. Above 100 means the index is up for the year; below means it’s down. The model finds the three closest historical matches by correlation across 125 years of data and runs a separate 500-path statistical simulation. When both methods come together, the signal is stronger.
As of May 22nd, Mass Pressure sits at 105.24. The Dow closed at 50,580, up from a year-start level of 48,063. The path wasn’t straight. The market sold off to 93.97 around day 86 (March 30th) before recovering through April and May.
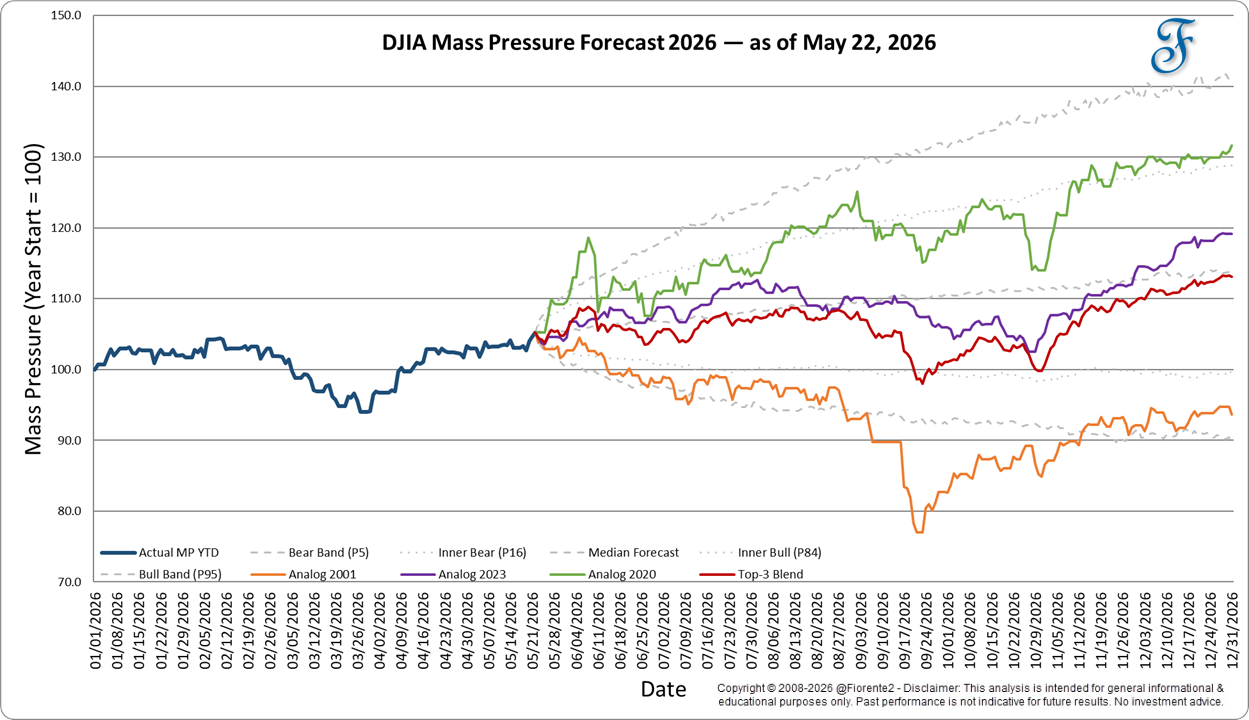
The five gray lines on the above chart come from 500 simulated year-end paths based on the past 60 days of market volatility. The middle dashed line is the median. The inner dotted lines bracket 68% of paths, the one-sigma band, two out of three simulated years. The outer dashed lines cover 90%. They currently run from MP 89.9 to MP 141.4: a wide spread consistent with the analog divergence below.
How the analogs tracked 2026 so far.
The three analogs tracked 2026 through different parts of the year before separating.
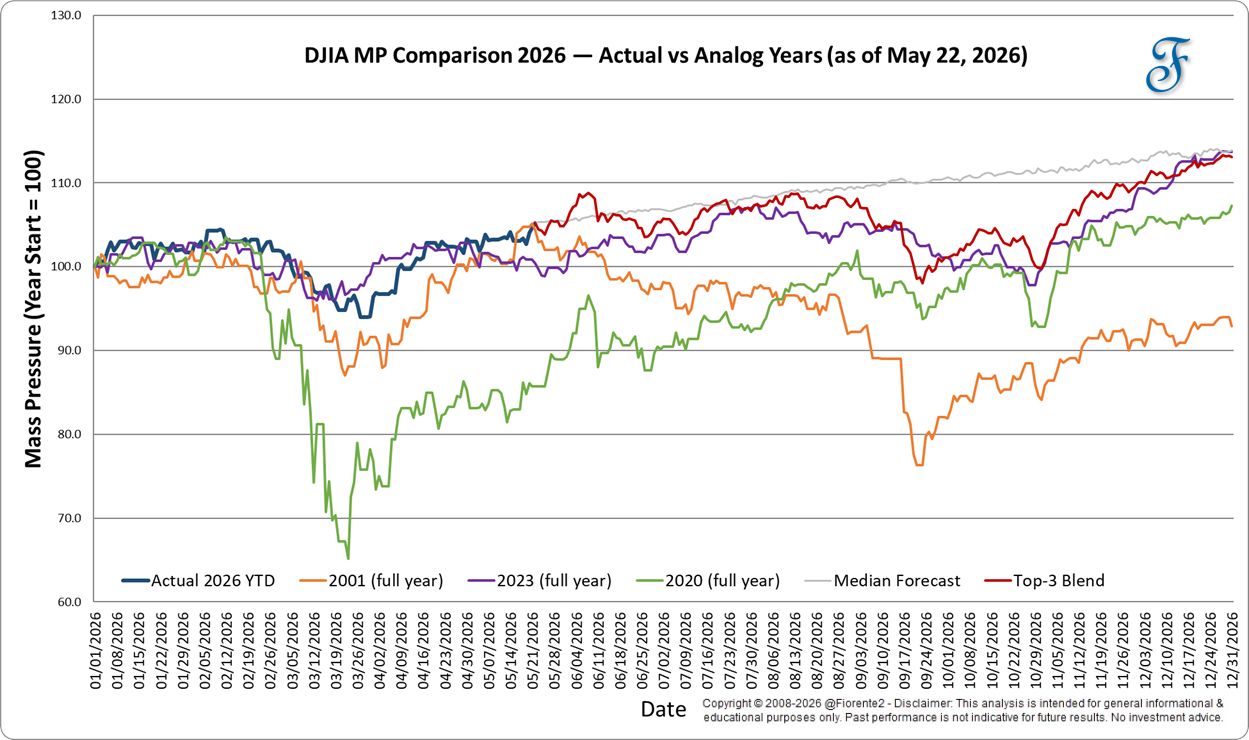
The year 2001 (orange, r=0.84) is running almost side by side with the actuals of 2026: 104.36 vs 105.24 at day 142 (May 22nd), less than one point apart. Both had a sharp spring selloff and strong recovery. In 2001, the path from day 141 (May 21st) turned lower. The market declined through the second half and closed the year at MP 93.68, implying a Dow equivalent of around $45,000.
The analog year 2023 (purple, r=0.67) tracked January almost identically but stalled in the spring recovery, sitting at 100.42 by day 142, five points below 2026. Full-year path points to ~$57,000.
The 2020 analog (green, r=0.66) diverged sharply after the COVID crash and by day May 22nd had only recovered to 85.73, nearly 20 points below 2026. Full-year forecast implies ~$63,000, but the paths look nothing alike from March onward.
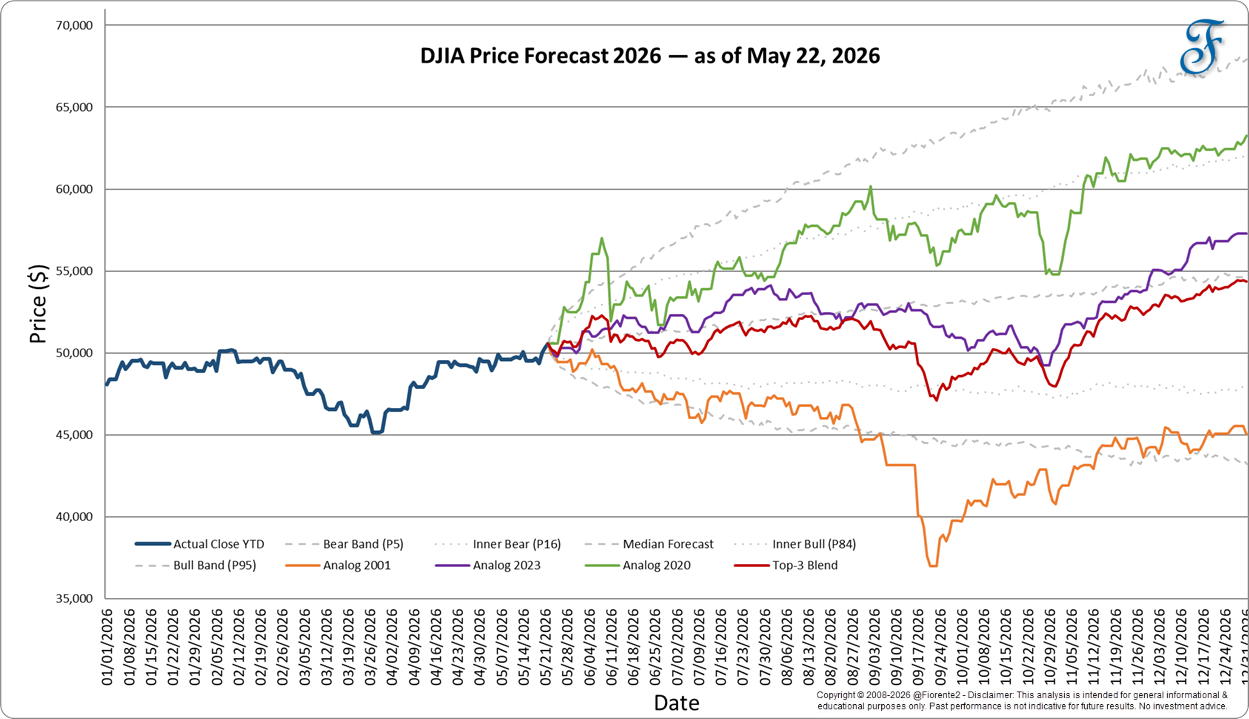
How the analogs may track 2026 continuing its past pattern, starting from May 22nd, price level is plotted on the next chart. The middle path is a blend — useful as an anchor, less so as a directional forecast when the analogs are pulling this far apart.
The 60-year cycle: 1906, 1966, and 2026
The 60-year cycle is the most important cycle I track. Often themes from the past resonate on this 60-year sequence. The probable mechanism is astronomical. The seven classical planets, the ones the days of the week are named after, return to the same position in the sky on a 60-year cycle. The 120 and 180-year multiples mark further full rotations and are worth tracking alongside.
Gann called it “the greatest and most important cycle of all, which repeats every 60 years or at the end of the third 20-year cycle” and cited as evidence the 1861–1869 war and panic repeating structurally as 1921–1929.
Kondratiev independently identified long economic waves of roughly 50–54 years from capital investment cycles, the same neighbourhood.
The DJIA dataset, from 1900 onwards, holds two instances: 1966 is the 60-year echo of 2026, and 1906 is the 120-year echo.
The 1906 → 1966 pair shows genuine structural similarity through the first half (r=0.74 through day 142): mild January rally, spring selloff, both below 100 by late May. After day 142 (May 22nd) the echo broke down: 1906 recovered to nearly flat (MP 98.08), while 1966 fell to a trough of 76.79 in October and closed at 81.06, down 19%. Full-year correlation drops to r=0.29. The cycle reproduced the first-half pattern but split on the second half.
2026 has already separated from both prior instances. Where 1906 and 1966 were in the red by late May, 2026 is up 5.24%. The spring dip-and-recovery is present. But the recovery carried further than either prior cycle reached at this point. By May 22nd, 2026’s correlation to the 1966 path stands at r=0.22; the structural echo is there in the first half, but the second-half paths are pulling apart.
What the numbers say
The statistical median and the analog blend both land near 113–114 by year-end, roughly $54,000–$55,000. When two independent methods land on the same range, that’s worth weighting, reducing the chance the middle is just a meaningless average of divergent paths. A spread this wide across the top-3 analogs signals regime uncertainty: the model has no strong directional lean when the analogs pull this far apart.
The 2001 path is the one to watch. Strongest correlation, tracking 2026 point-for-point right now, peaked at the same point in the calendar, and historically declined from here.
The Mass Pressure model places the rollover risk in the same half of the calendar that the planetary framework from #303 identified. The analog doesn’t pinpoint July specifically, but both frameworks point to the same second-half window.
What to monitor
Whether Mass Pressure holds above 100 through June. A break below the year-start level brings the 2001 bear path back into focus.
The distance between 2001 and 2026 on Chart 2. Right now they’re aligned. If 2026 continues higher, the bearish echo is loosening its grip. The inversion scenario from my #303 “Wheels within Wheels” article gains further probability.
The 1966 path as the primary 60-year reference. Watch whether 2026 continues to separate from it or whether a summer correction starts to close the gap. (See my article: #286 The Sixth-Year Itch: A Forecast for US Indices in 2026.)
The June 17th Fed decision. CME FedWatch currently prices a 98% probability of no cut. In 2001, the Fed was cutting aggressively through the second half, 11 reductions from 6.5% to 1.75% by year-end. That policy cushion doesn’t exist in the same form today. A market that weakens without Fed support moves differently than 2001 did.
Whether the reported US-Iran framework agreement moves toward implementation. A reopened Strait of Hormuz removes an oil risk premium from the market, which historically supports equities and takes away one of the macro disruption events that could otherwise accelerate the bearish path. If it progresses, it favors a continuation of the inversion scenario into July.
Conclusion
The Mass Pressure model and the cycle framework from #303 point to the same stretch of the calendar from different starting points. The closest statistical analog peaked last Thursday (21st) and historically declined from here. The planetary cycle window lands in early July.
We’re dealing with probabilities. Neither method specifies the outcome: the 2001 bear path, the 2020 bull recovery, or something in between all remain on the table. The 2001 analog tracked 2026 point for point to last Thursday. The road to July 4th is six weeks out. Time may tell.
Remember, cycles can contract, extend, and invert. I may be wrong, of course. Anomalies can occur, fundamentals can shift, so be cautious.
In case you haven’t noticed, I post various charts in the Substack notes every week. You can find them all here. (click on the link)
P.S.: Occasionally, I share new analyses exclusively for free subscribers. Subscribing gives you email updates on these posts, plus extra insights and deeper research from the time you join onward; past analyses are not included.
If you liked this post from @Fiorente2’s Blog, why not restack and share it?
© 2008–2026 Fiorente2.com. All Rights Reserved.
Disclaimer: This analysis is for informational and educational purposes only and should not be considered investment advice. Read our full disclaimer.
Disclosure: From time to time, I may hold positions in the securities mentioned.
Great analysis as usual!
I do not have your tools and knowledge. But I'm still focused on Jupiter opposing Pluto and the north node beginning late July.
Is the only transit I find that might bring stress. The rest seems rather favourable.
I'm also tracking the 36y cycle. 1990-1991 saw a mild recession.
new uptrend was just started since March. tracking 60yr cycle is meaningless cuz it has been inaccurate for two years. Like you said, the market speaks itself and it is always right. You cant just find the excuses to change the date like 5/10,5/21,7/4 if the top is not formed. You should find a new method instead of a new excuse. What u gotta say if the market keep going up after your final date 7/4? Find another date and reason?this is what u have been done in past two yrs,this is not right. You making a big directional mistake and u don’t wanna revise. People subscribed u because they wanna learn from you,or earn some money based on your predictions.but u keep going wrong for two years without any revision.people can either learn nothing from your wrong method or go bankrupt from your prediction. Things become meaningless. You don’t need to reply cuz I ain’t read your post any more. U need to wake up.dont trap yourself in a same mistake cycle. That mistake cycle is the real cycle for u.