

Introduction
Last week (#318) I posted an update on BTCUSD using the Hexagon grid, both in price and time. I used 90 degree increments in price and plotted 60 degree time increments from the April 7th, 2025 low. Eyeballing the grid, it fitted the turns in Bitcoin rather well.
In less than a week, volatility returned to Bitcoin. It ran straight through the $66K and $74K resistance lines from last week’s post and now trades near $77K price level, close to the $81K-$82K zone.
In today’s post I have revisited the Hexagon grid and plotted the time grid from the crest of October 6th, 2025, which may give even better potential turning points around it. Given the foldback came earlier than expected, I have adjusted it too, now plotting it from the July 3rd, 2026 cycle return around the Hexagon cube.
Let me walk you through my analysis.
The Hexagon Cube
The below Hexagon cube starts with the October 6th, 2025 crest in the center. Moving a day at a time, you may find important turning points at each 360 degree turn on this cube, like we saw recently in May, July and perhaps the upcoming date of September 1st, 2026. I have highlighted these on the horizontal axis.
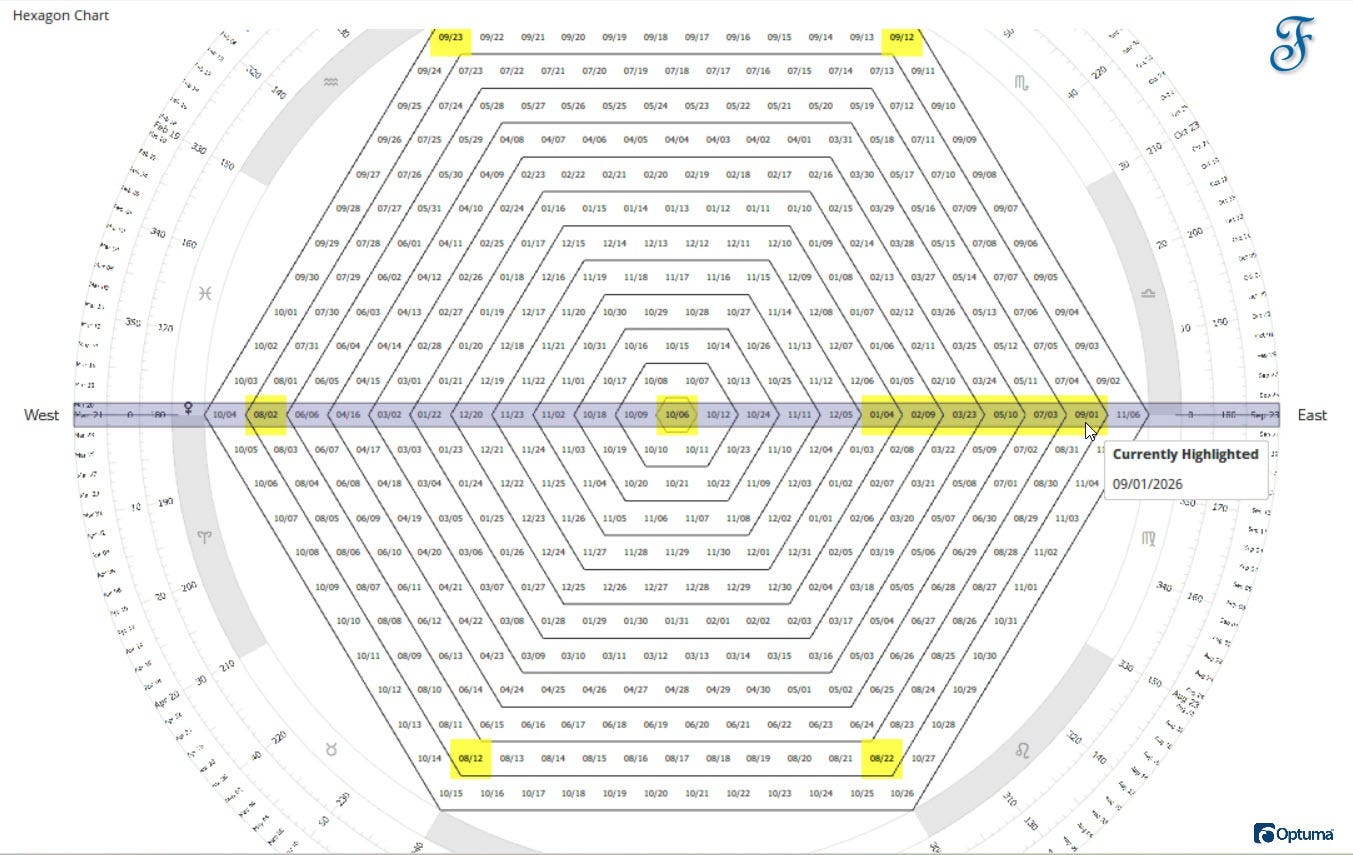
I also highlighted each 60 degree corner in the above chart, and this may give interesting turning points as well. The next corner is this weekend, on August 22nd, and the next one, September 1st, 2026, is the 360 degree turn around this cube.
I have plotted some of the dates and the upcoming corners on the below Chart 2 along with the price levels in equal parts of 90 degrees as explained in my post a week ago.
Where price and time meet, these often become inflection points, where the trend can continue or revert. The 90 degree price level increments are important levels, as you know. In a building, a 90 degree angle is a hard angle to break.
Bitcoin Hexagon Grid (updated)
In the below chart I have updated the hexagon grid in time from the October 6th, 2025 high. I have marked in blue the dates that complete a 360 degree turn in time around the cube. The 90 degree price levels remain as explained in last week’s post. This is how to overlay the Hexagon cube on a 2-dimensional chart.
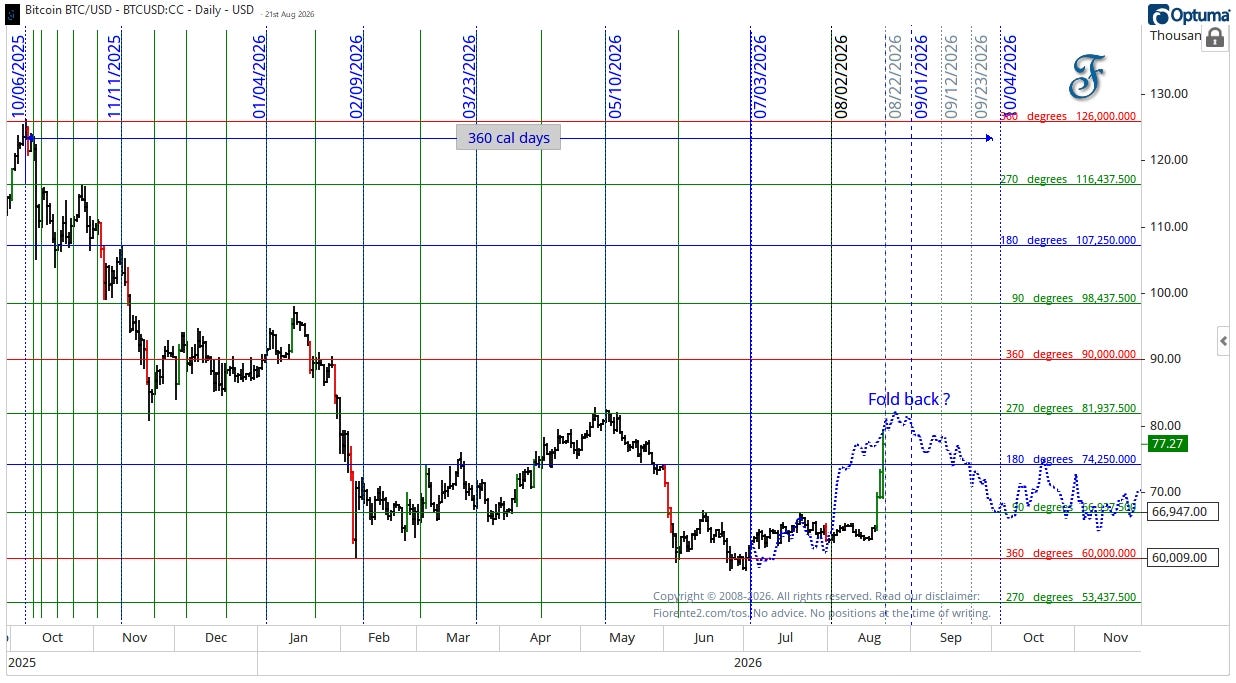
The foldback has been plotted on the above chart from the July 3rd, 2026 date and is still pointing to where possible resistance may be found. Note: at some point in time these foldback scenarios may cease to function.
You may recall what Gann wrote about support-and-resistance lines.
“It is safe to buy when a stock reacts to old tops the first, second, or third time, but when it declines to the same level the fourth time, it is dangerous to buy as it nearly always goes lower” (Gann, Stock Market Course, 1955).
This works for bottoms as well. So, despite the foldback scenario pointing at a more positive forecast for Bitcoin, I have not yet abandoned my June Bitcoin forecast to trade lower to the $54K level.
Conclusion
As I mentioned last week, a push through the $66K level may bring Bitcoin back toward $74K and the $81K-$82K zone, where the May 2026 high and the 270 degree hexagon level line up.
There is quite some resistance here. This would be the third time this year and the fourth time since the October 2025 crest that Bitcoin may revisit this $81K-$82K price level. Remembering Gann’s words about old support and resistance, a push through this level may invalidate my foldback scenario. On the other hand, note what he said about the fourth time.
Keep in mind, cycles can contract, extend, and invert. I have no crystal ball, and a Hexagon grid only maps the ground. Always watch the chart in front of you. Be careful out there. No advice.
If you liked this post from @Fiorente2’s Blog, why not restack and share it?
© 2008–2026 Fiorente2.com. All Rights Reserved.
Disclaimer: This analysis is for informational and educational purposes only and should not be considered investment advice. Read our full disclaimer.
Disclosure: From time to time, I may hold positions in the securities mentioned.