
Update on the DJIA and fresh analysis on various stocks
#295 Update on the DJIA along with new analysis of multiple stocks including CRM, META, MSFT, RBLX, SLB, AMCOR, and Gen Digital.

Introduction
The 4-year and 60-year cycles in US and global indices may not have reached their lows yet, as market volatility continues amid the conflict in Iran. During these times, I prefer to stay out of the markets and see how things unfold. Once volatility subsides, there will likely be good opportunities to enter new positions. In this DJIA update, I am sharing new research and analysis on stocks like CRM, META, MSFT, RBLX, SLB, AMCOR, and Gen Digital.
Though it’s not the end of the week, I wanted to share my latest update on the DJIA before heading out for a long weekend. All of the data is as of March 25th, 2026.
I’ve included some new and interesting research on various stocks that may be approaching an inflection points.
DJIA - The 60-year Cycle & Planetary Time Clusters
New readers may want to read my previous post first. You can find it here.
The DJIA is continuing its course like clockwork following the 4-year and 60-year cycles.
In the updated chart below, based on last week’s chart, I have plotted the cumulative hard aspects (0, 90, 180 degrees) of planetary transits and included planetary geometries. This illustrates the Time Cycle Clusters at the bottom of the chart, where the highest volatility and market activity are expected. I have added a green overlay of a 60-year cycle.
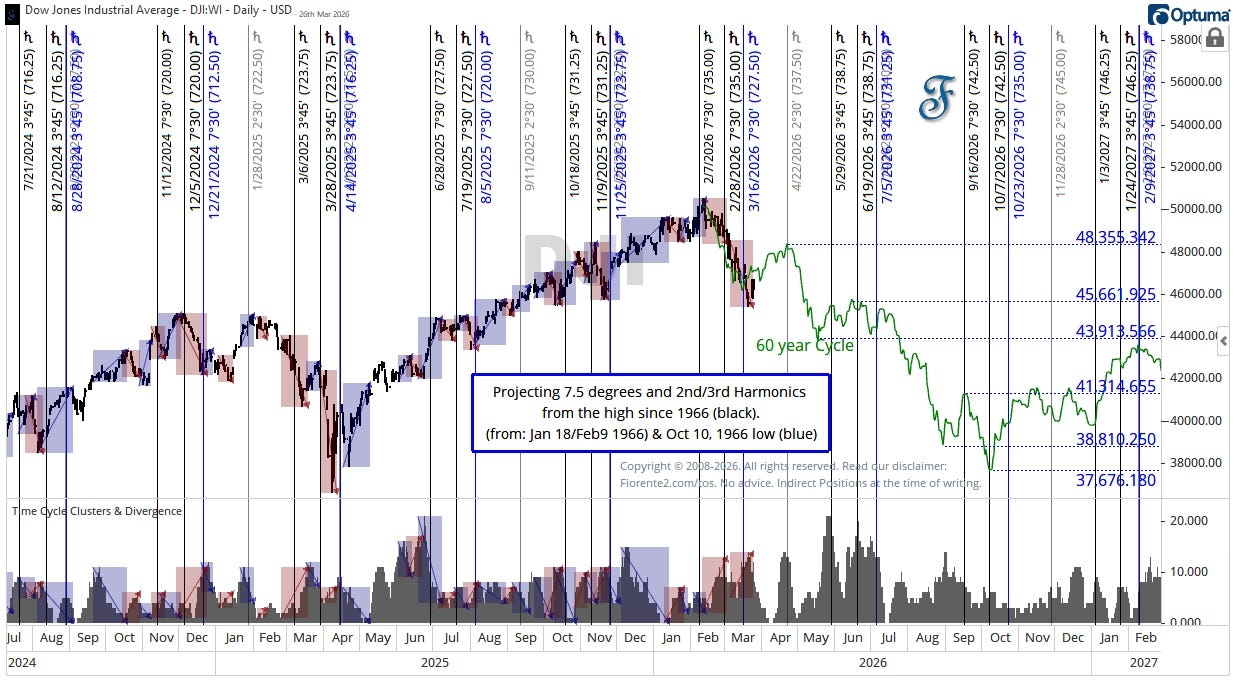
I have plotted the 60-year cycle from the same calendar day as 60 years ago (February 9th) in green, and we may be close to an inflection point, provided the DJIA continues to follow this same pattern as seen 60 years ago. Even after 60 years, there is an interesting similarity between the 1966 and 2026 inflection points.
Zooming in on the same chart and time clusters, you can see that an increase in Time Clusters, hard planetary aspects, often causes a decrease in price over time. A decrease in time clusters may often cause an increase in Price.
Based on the cluster of various cycles I mentioned last week, I expected the decline could continue into the latter part of March. As cycles continue to influence even after reaching a certain (hard) aspect, this could extend into the end of March. On the chart, we may soon enter a short period into April (Easter?) during which period we can expect a slight recovery. After Easter, I see the hard aspects increasing again.
Due to the recent panic over the Oil Crisis in Iran and fears that inflation and rising interest rates may return, the downtrend has been more volatile than it was 60 years ago. This may persist if the crisis continues, and the projected rebound in April may not recur as seen in 1966.
DJIA - 4-year Cycle
The chart I showed you earlier displays the long-term trend from March 2020 onwards. The mid-March low was similar in price and time to that of 4 years ago. I have plotted the 4-year analog in dotted black on the chart to remind ourselves that what happened 4 years ago may happen again.
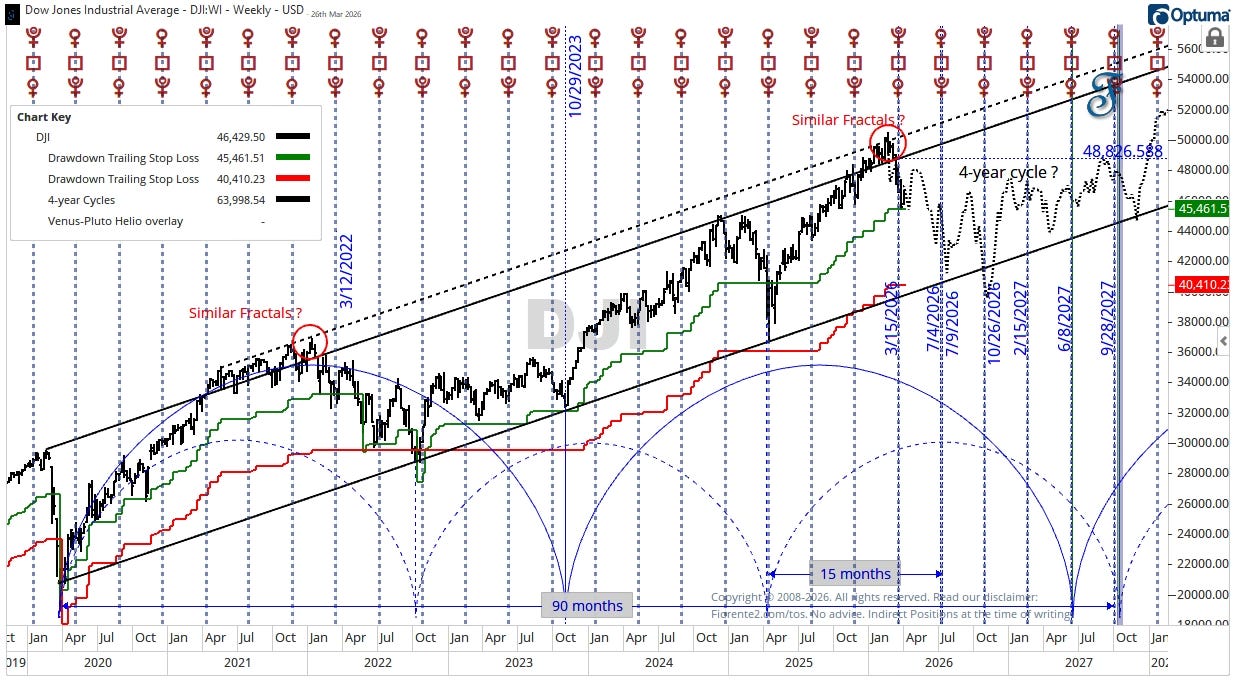
The DJIA is currently finding support at a 10% decline from its February 2026 peak. If the downtrend continues and falls below this level (indicated in green on the chart), we may see a decline of around 20% from the peak, which corresponds to the lower trend channel line.
From the research table
In this section, I am sharing some very interesting research from my desk on various stocks that have reached key price and time levels, or may be very close to them.
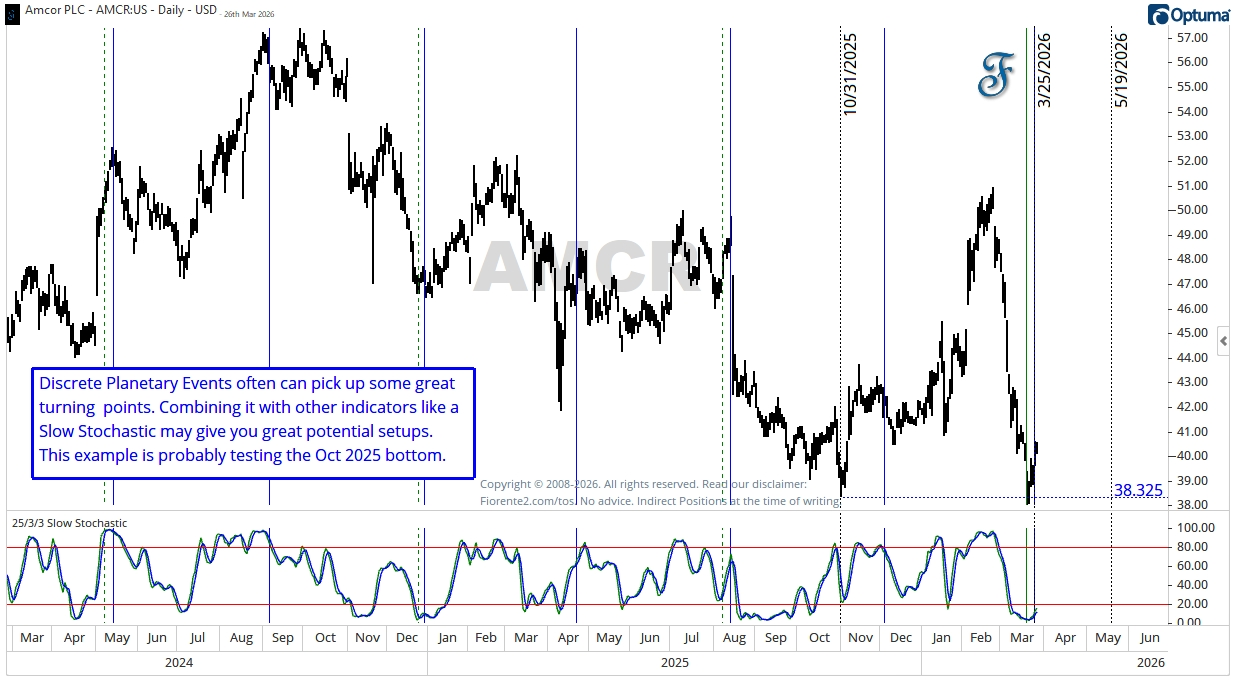
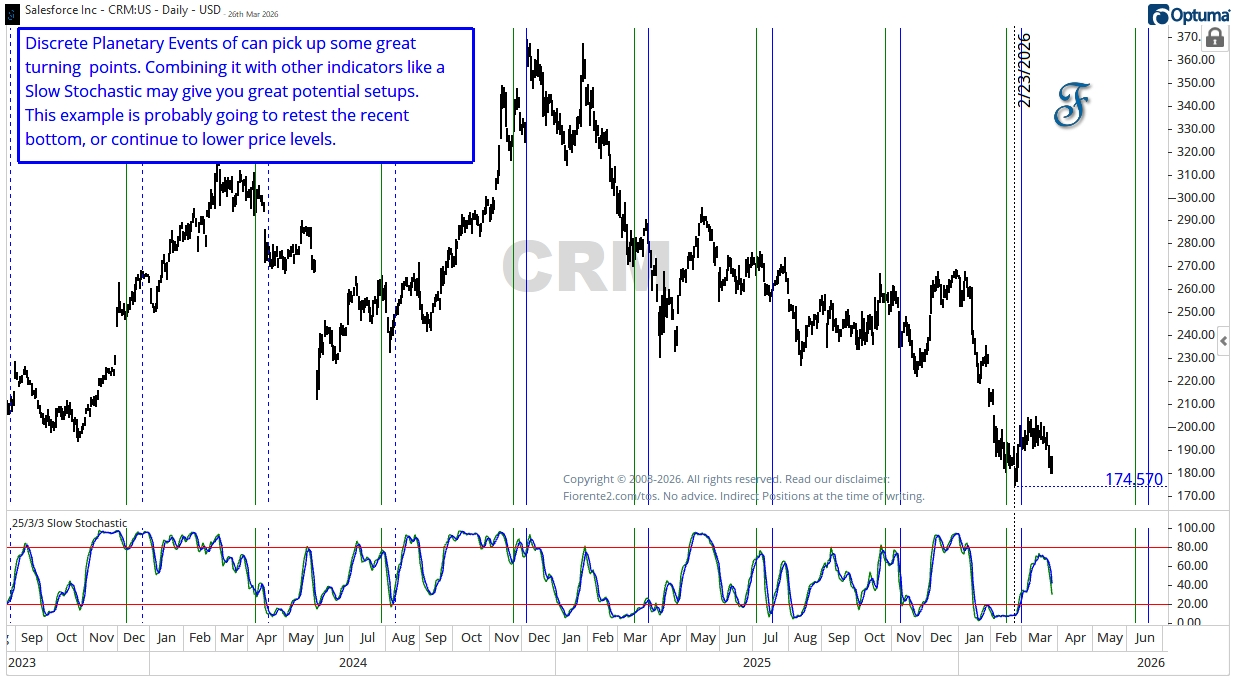
My research is based on discrete planetary events that occur in sequence, with significant highs and lows over the last 5 years or less, for stocks with less than 5 years of history.
Although my research is still in its early stages, it shows strong merit when a stock changes trend in line with these planetary steps or events, moving from highs to lows.
I’m beta-testing my research and automating it, which will allow me to receive automated signals in the near future. So, be careful to draw conclusions already based on the stock analyses I am sharing below.
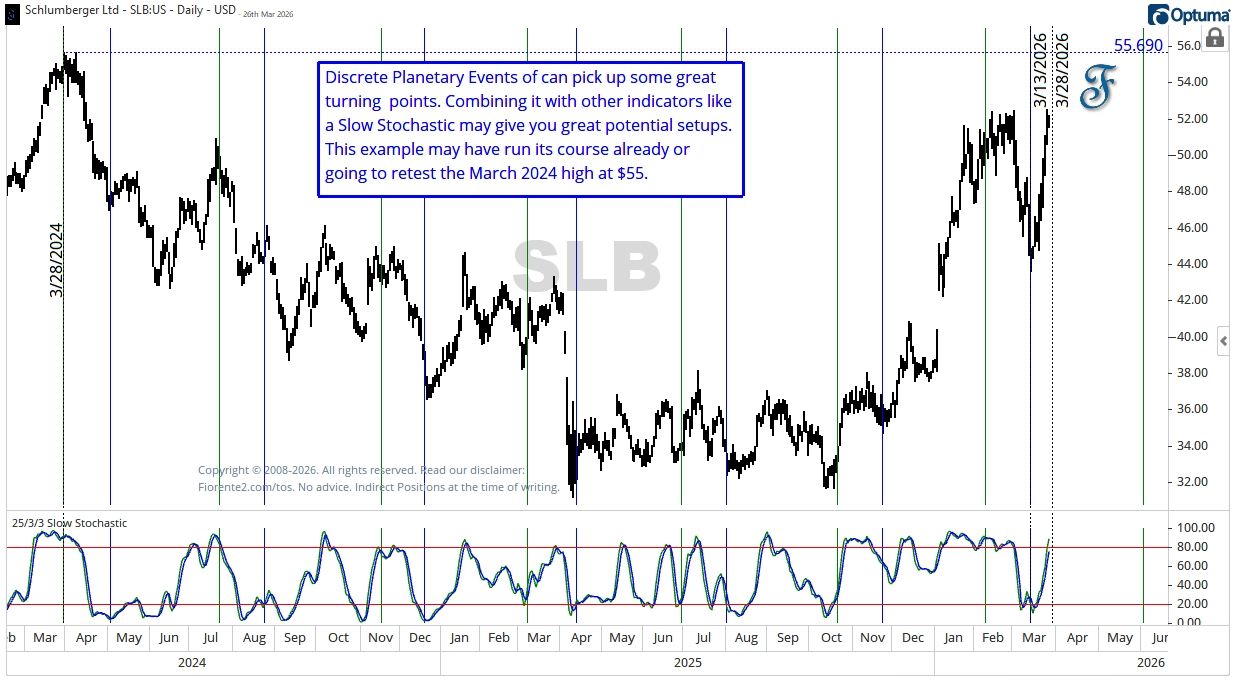
Note: The solid blue lines on the chart originate from the top, while the green lines originate from the bottom, both projecting forward. The dashed blue and green lines indicate the reverse planetary steps (if applicable).
I have provided comments in the various charts, so I will not add further commentary. The charts are in alphabetical order.
AMCR - Amcor PLC
CRM - Salesforce Inc
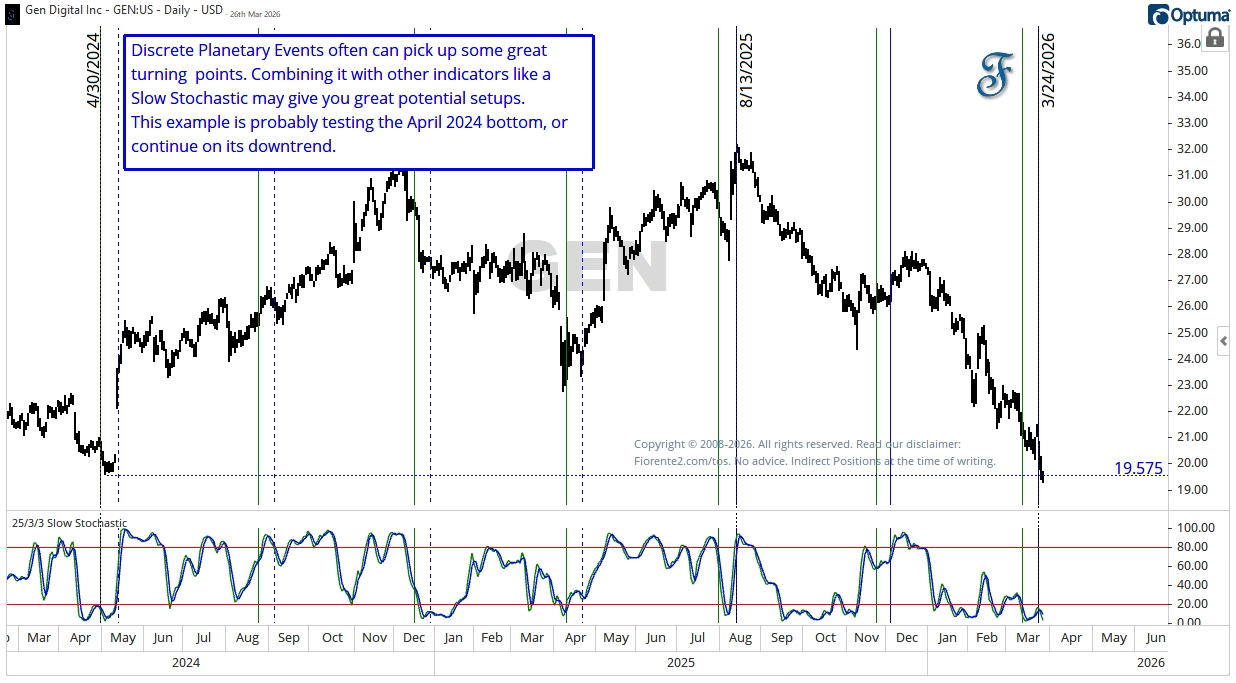
GEN - Gen Digital
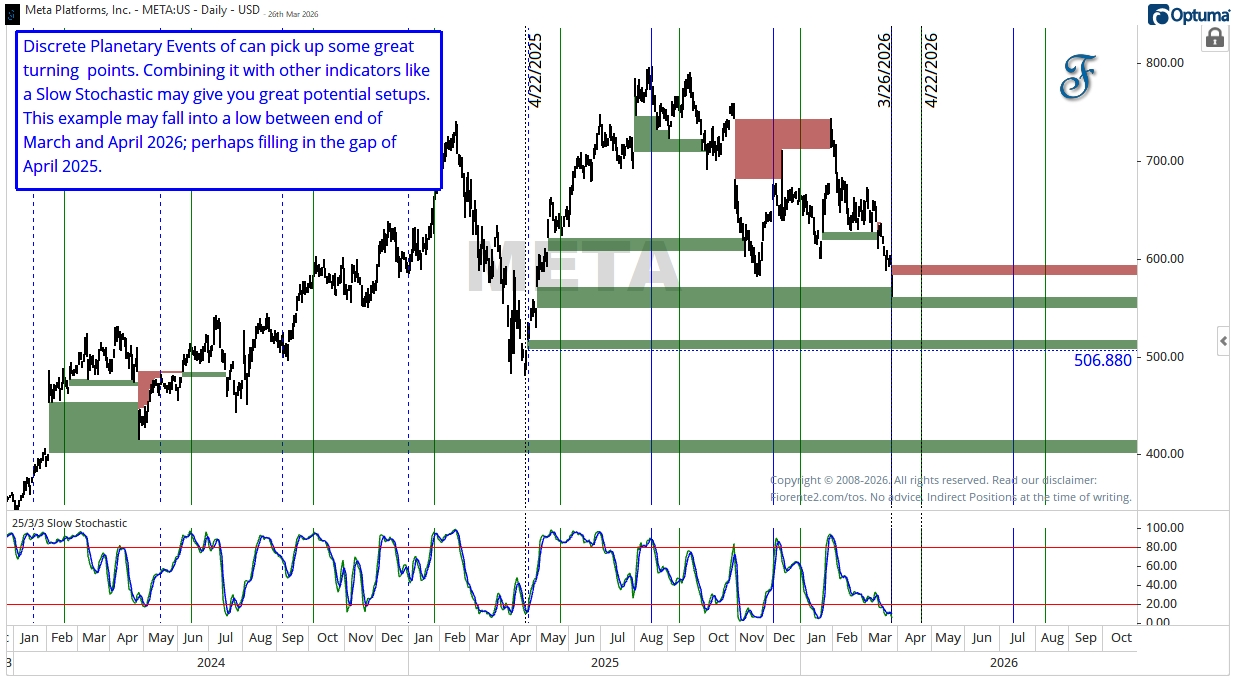
META - Meta Platforms Inc
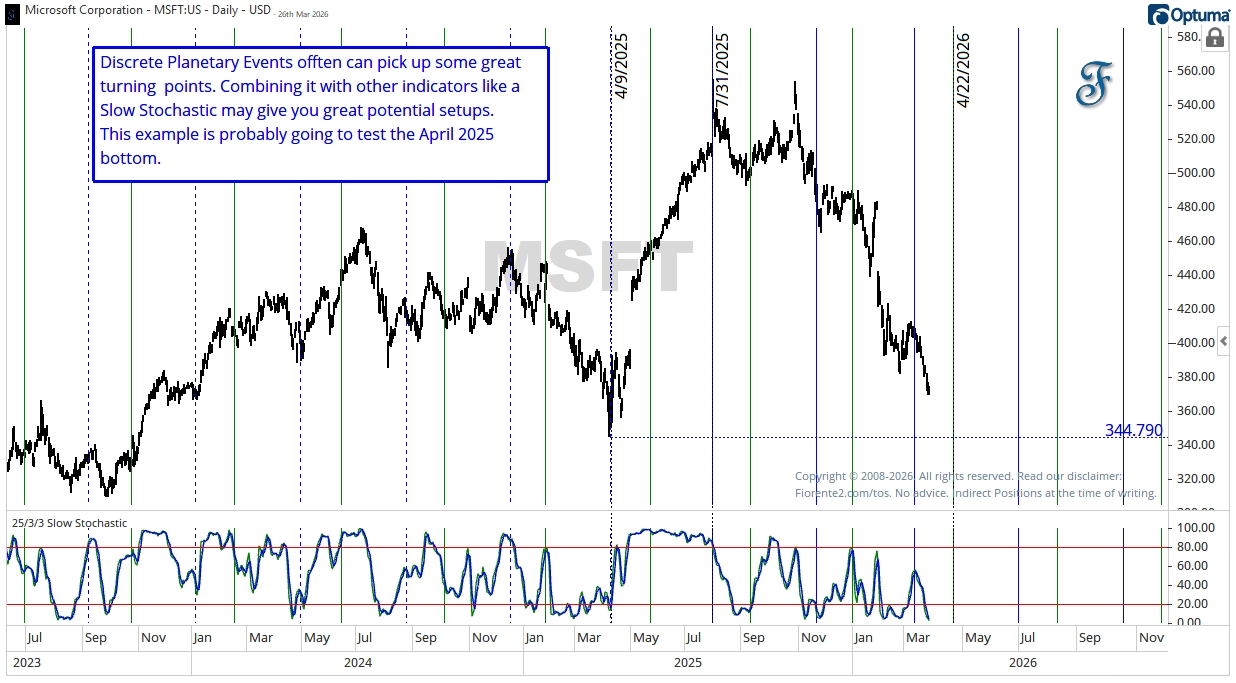
MSFT - Microsoft
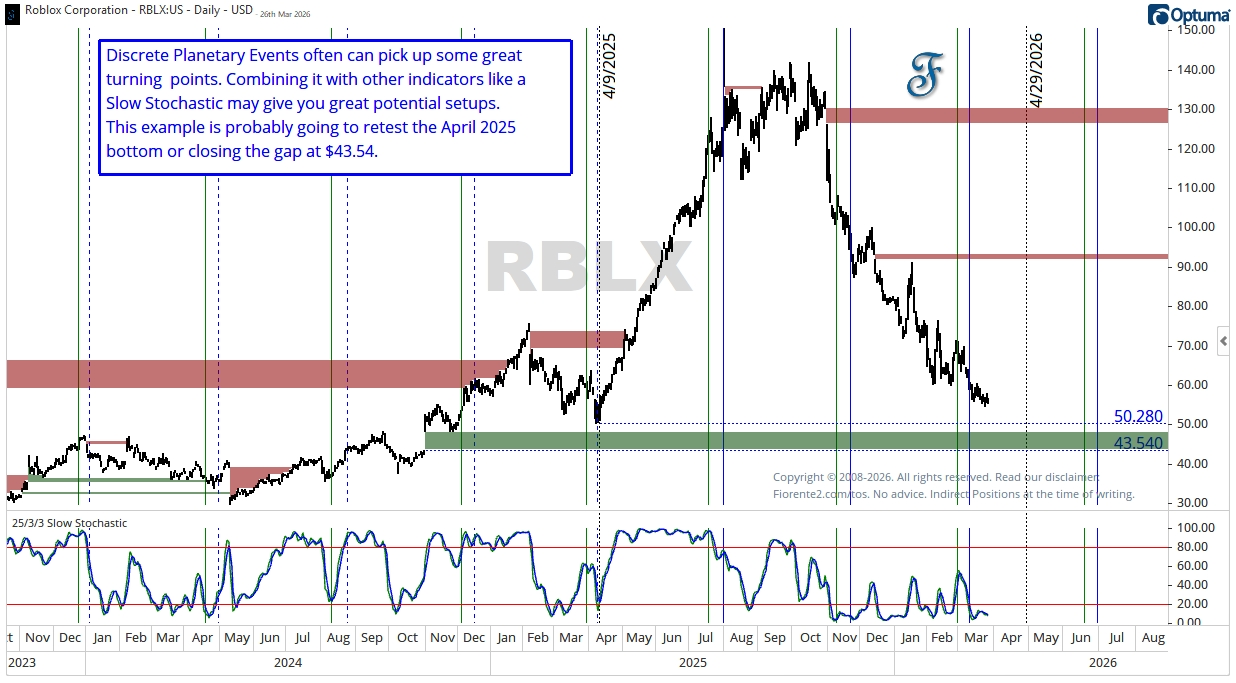
RBLX - Roblox Corporation
SLB - Schlumberger Ltd
SPG - S&P Global Inc.
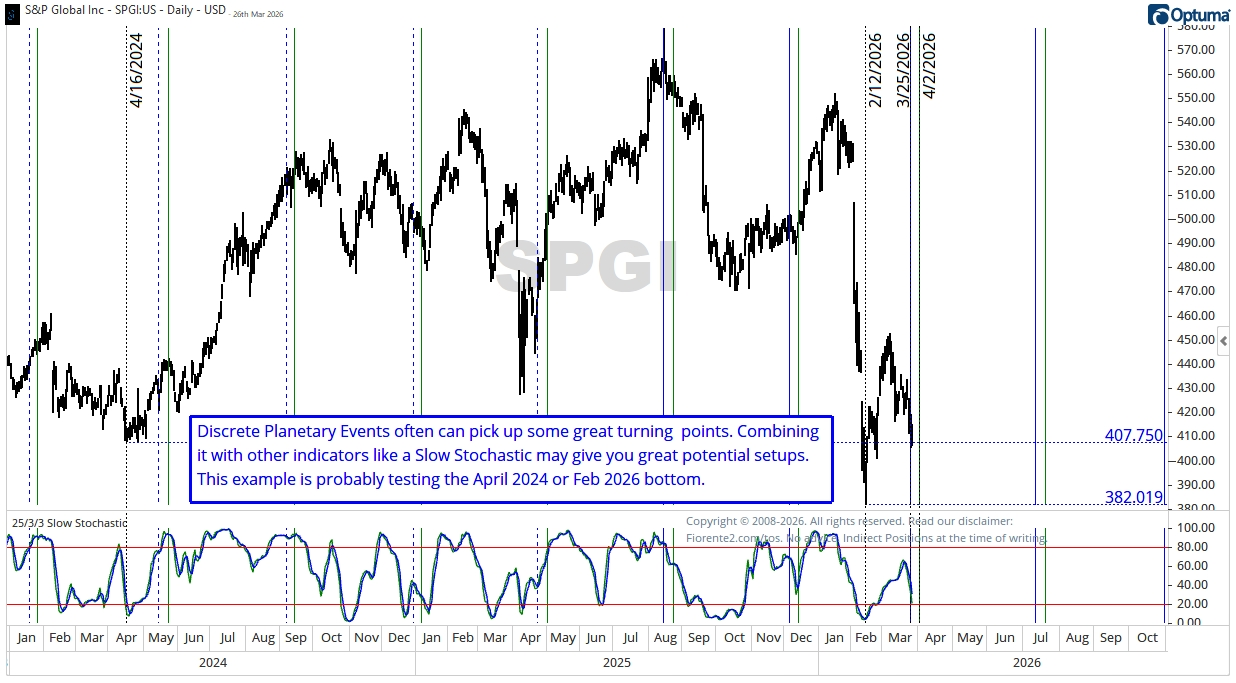
As you can see on the various charts, a confluence of important planetary steps from past highs and lows always needs to be confirmed by additional indicators, such as the slow stochastic on these charts. Even then, that may not be enough, as this indicator can stay overbought or oversold for some considerable time.
Looking back at past inflection points, I’ve noticed that when planetary movements align with key moments, there is a higher probability that a trend change may occur. Remember, though, that these insights are observations and not specific advice to buy or sell any stocks.
Conclusion
I will not make a summary conclusion of today’s post. I let the charts speak for themselves.
The financial markets are highly volatile right now, and this may continue for a while, as there is no clear path to the end of the war in Iran. At times like this, I stay out of the markets and will see what happens. When volatility subsides, we may see some good opportunities to take new positions.
Remember, cycles can contract, extend, and invert. I may be wrong, of course. Anomalies can occur, fundamentals can shift, so be cautious. I expect some significant volatility ahead.
As there is always a lot to cover in financial markets, I sometimes make a quick note here on Substack, which lets me spend more time on research rather than writing a lengthy article.
Make sure you have notifications turned on in the web browser or the app to receive a quick post as a note. If you don’t know how to do that, please visit the Substack help files or ask Google Gemini.
As I am enjoying a long weekend off from the computer, I am not able to answer your questions or remarks. Please feel free to send me a Direct Message in the Chat function with, so I will pick up your queries once I am back in the office on Monday.
PS: I prefer answering on DM’s to save me time to spend on more research.
In case you haven’t noticed, I post various charts in the Substack notes every week. You can find them all here. (click on the link)
P.S.: Occasionally, I share new analyses exclusively for free subscribers. Subscribing gives you email updates on these posts, plus extra insights and deeper research from the time you join onward; past analyses are not included.
If you liked this post from @Fiorente2’s Blog, why not restack and share it?
© 2008–2026 Fiorente2.com. All Rights Reserved.
Disclaimer: This analysis is for informational and educational purposes only and should not be considered investment advice. Read our full disclaimer.
Disclosure: From time to time, I may hold positions in the securities mentioned.