Unraveling Economic Clues: Can JNK High Yield Bond ETF Be Our Compass?
JNK High Yield Bond ETF: A Canary in the Coal Mine?
As an investor, you may have wondered if the JNK High Yield Bond ETF holds any predictive value for the market's future. This intriguing query has sparked interest among many, and it's indeed a hypothesis worth investigating.
JNK, an ETF that tracks high-yield or "junk" bonds, can essentially gauge investor risk appetite, given its association with companies with lower credit ratings. An uptick in JNK’s performance often signals bullish sentiment, suggesting investors are ready to take higher risks and anticipate a favorable economic landscape. On the other hand, a dip in JNK's performance can signal bearish sentiment, a common sight during less robust economic phases when investors gravitate towards safer havens.
We are currently observing an atypical trend, which breaks away from the customary correlation between JNK and the S&P 500 Index (SPX). Although these two usually synchronize, mirroring the broader market sentiment, they have recently embarked on divergent paths, hinting at an escalating sense of uncertainty and potential market volatility ahead.
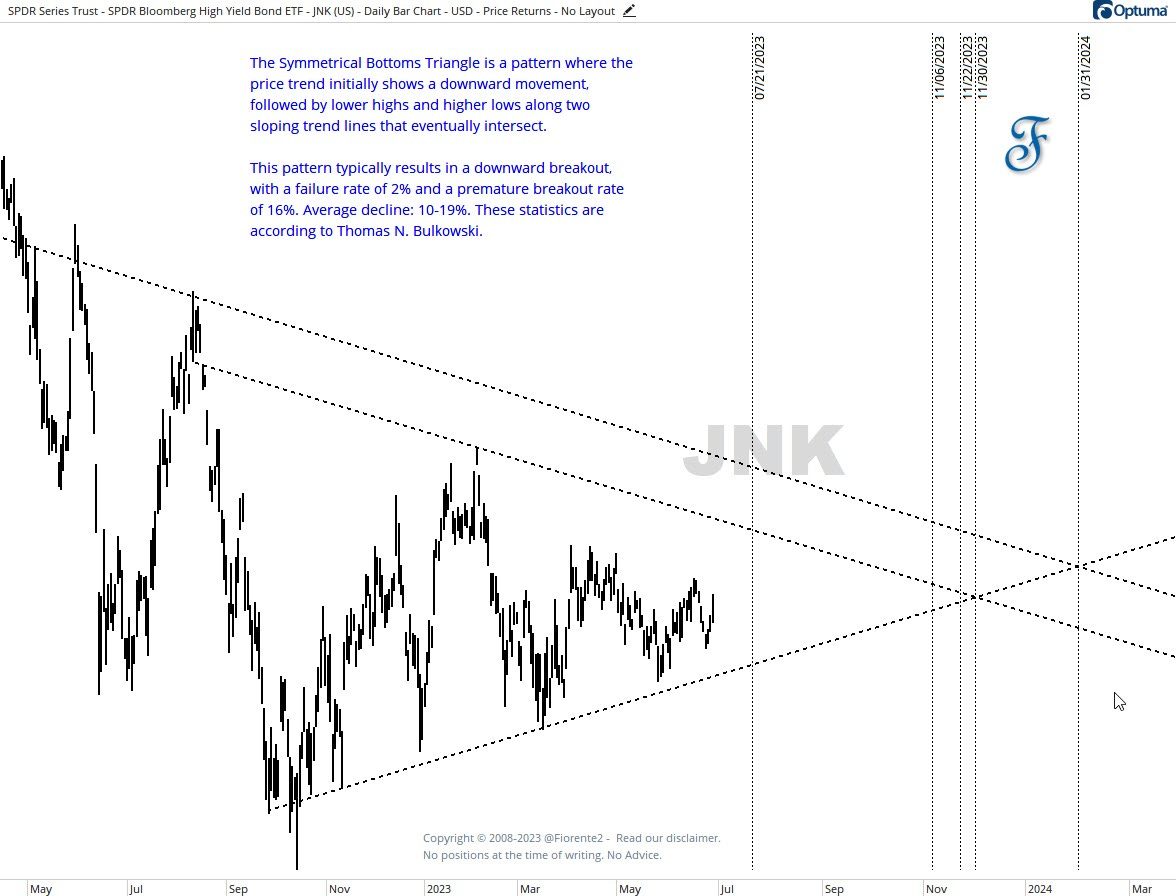
This brings our attention to an intriguing pattern forming within the JNK ETF - the Symmetrical Bottoms Triangle. This pattern, characterized by lower highs and higher lows on two intersecting trendlines, often indicates a coming downward trend.
How does this tie in with the broader market? Let's turn to the studies conducted by Thomas N. Bulkowski. According to Bulkowski, the Symmetrical Bottoms Triangle pattern often portends a downward breakout. His statistical observations suggest that this pattern results in a downward breakout with a minimal % failure rate of 2% and a 16% chance of a premature breakout. The average decline tends to be within the range of 10-19%.
In light of Bulkowski's observations1, unless JNK makes a positive rebound soon, we could witness a downward trajectory at or before the pattern's apex. This may indicate a more bearish economic outlook, potentially impacting the broader stock market. However, we should proceed cautiously as these projections and numerous other factors can steer the final market direction.
The recent divergence between JNK and SPX and the Symmetrical Bottoms Triangle pattern suggests a market correction may be on the horizon. However, it's important to remember that the stock market is a complex system influenced by a variety of factors. While these patterns offer valuable information, they cannot be considered definitive.
While monitoring JNK as an economic indicator could be helpful, it's equally important to remember that it's one among many tools in our investing toolbox. At all times, it's important to conduct further research. In-depth research and a multifaceted approach are keys to successful investing, allowing a holistic view of the market.
Stay tuned as we continue to monitor and decode evolving market trends.
Disclaimer: This analysis is intended for informational & educational purposes. It should not be interpreted as a guarantee of future results or considered professional advice. Please refer to our full disclaimer. (Click on the link)
Disclosure: No positions in SPX or JNK at the time of writing.
Thomas N. Bulkowski: “Encyclopedia of Chart Patterns”, December 1999 (2000 Edition)


