
$TLT Forecast: Treasury Bonds Near a 24-Year Cycle Low
#307 | Where the 30-33 year Saturn cycle puts the bond bottom.

A reader asked me in May for my view on Treasury Bonds. TLT is sitting close to where it all began in July 2002, near a multi-decade low. I got distracted with other work, so apologies for the delay. With stocks at all-time highs, I had not looked at bonds for a while.
The 30-33 year cycle
The TLT-20+ Treasury Bond ETF is nearing the bottom from where it all started in July 2002. There seems to be a 30-33 year cycle probably related to Saturn in TLT.
Looking from the helio perspective the crest was set at an 18-year cycle high, on the Saturn-Pluto conjunction (at the same degree) in early 2020.
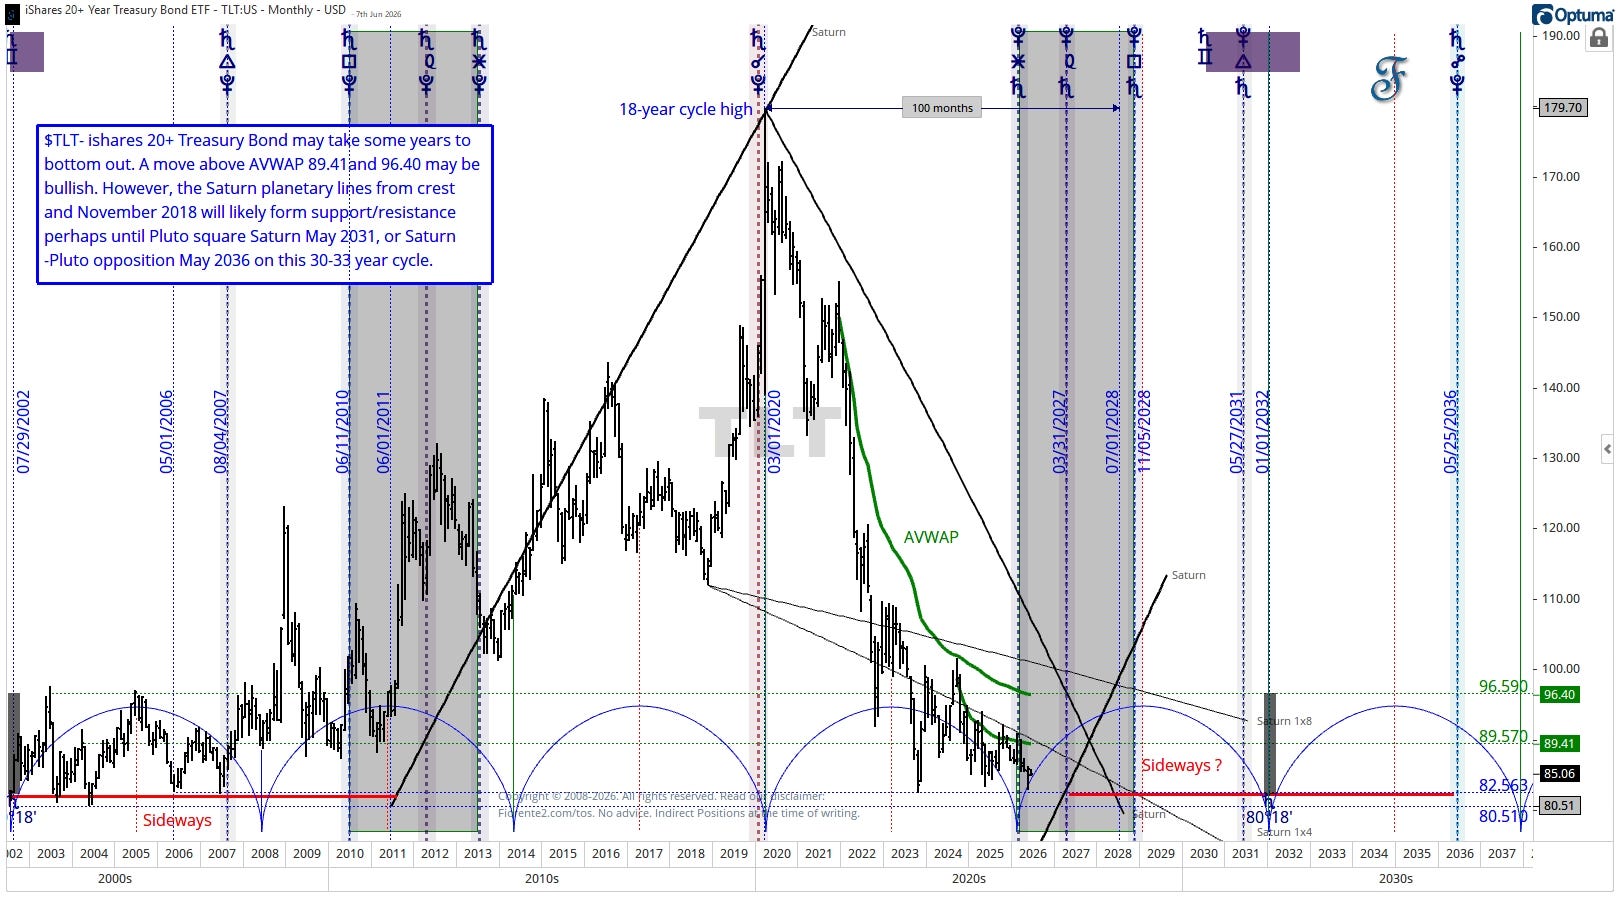
The Saturn-Pluto cycle is a 30-33 year cycle that seems active in the bond market right now. As shown on TLT 20+ Treasury Bond ETF on the chart above it may take some years from now to bottom out.
Current readings and levels
The Saturn planetary lines from the crest and November 2018 have tended to act as support and resistance, and on this 30-33 year cycle I would watch them into the Pluto-square-Saturn window around May 2031, with the Saturn-Pluto opposition near May 2036 in case the cycle gets extended.
At today’s levels (June 4th, 2026) a move and hold above AVWAP1 89.41 and 96.40 would favor the bullish case. A close back below 89.41 after that would keep the bearish case alive. Until then I would expect TLT to move sideways for quite some time, as indicated on the chart.
The sunspot angle
There seems to be a relationship with Sunspot highs and lows. When TLT started trading the Sunspots were close to a maximum, and the 18-year cycle high in TLT also fell at a Sunspot maximum.
There is a 9–11-year cycle in Sunspots, and it is not just eyeballed: the spectrum analysis I ran to extract the dominant Hurst cycle picks it out as a clear peak (see the chart below). So, the cycle itself is on firm footing.
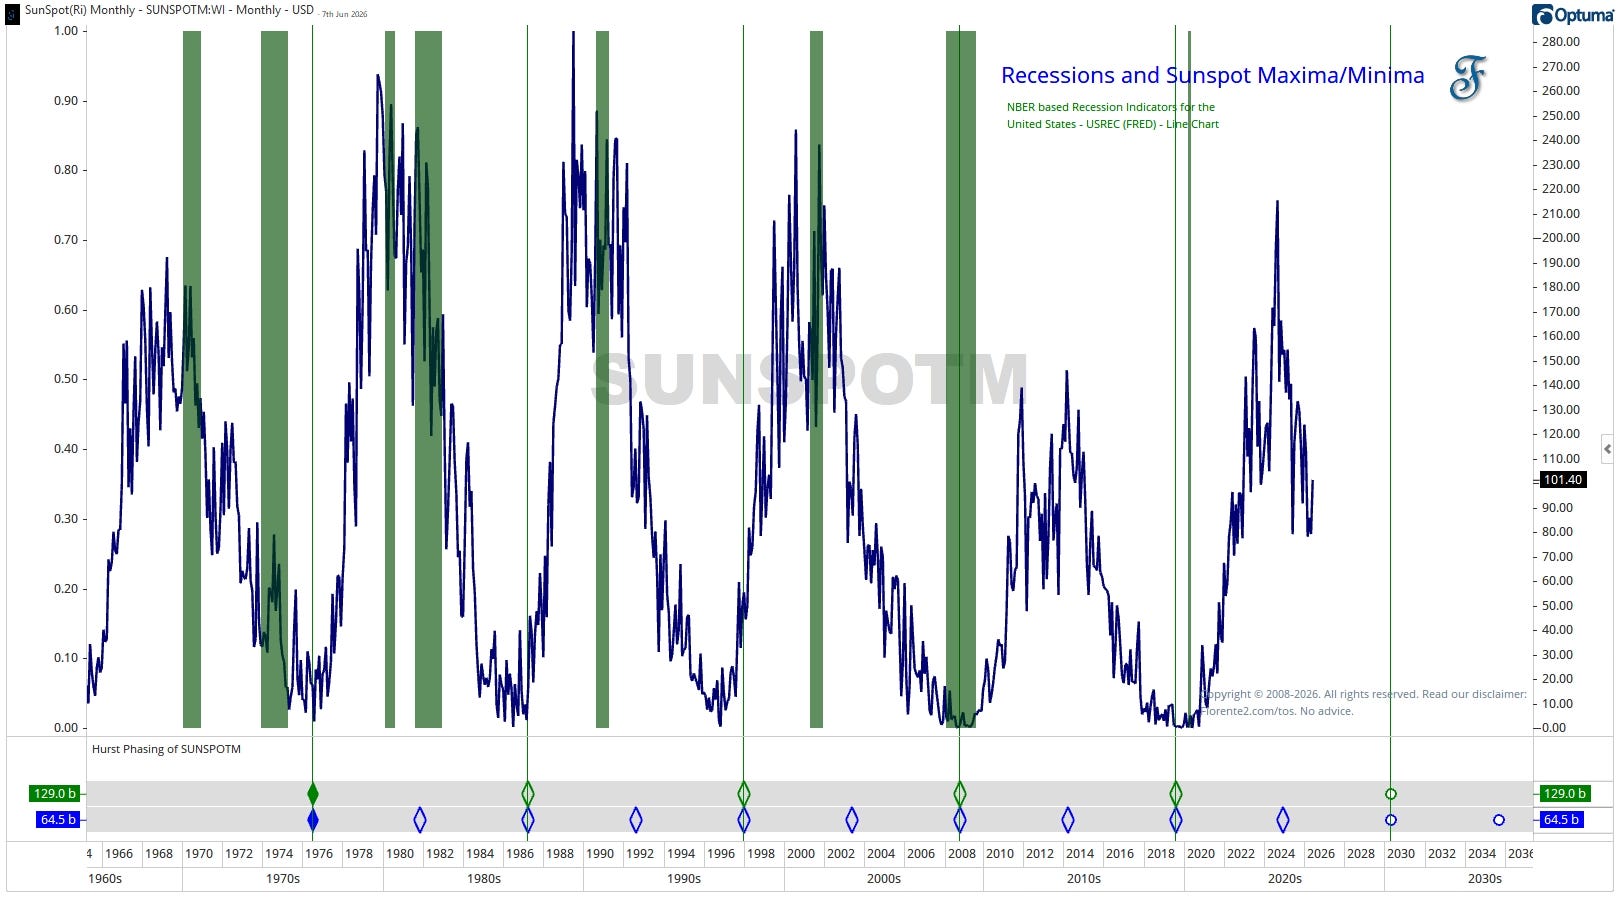
The link to recessions is the looser part, and I would be careful calling it a recession signal on this data alone. TLT has only traded since July 2002, so this is one cycle of its own history, something I am watching rather than a rate I would stand behind.
Current expectations do not put the next Sunspot low before 2030, which may coincide with the next Saturn heliocentric cycle transition.
Short-term timing and the stocks-bonds view
On the shorter term you may look at Mercury, Mars-Pluto, Venus, Venus-Uranus moves in TLT. I think Mars-Pluto aspects are worth watching most. On the Chicago Board of Trade first-trade chart (midheaven at 23 Gemini), Mars, Venus and Mercury aspects line up with bond turns often enough that I follow them.
This may favor stocks above bonds for some time to come. I would expect the larger investors to stay with stocks until the bond cycle turns, which is part of why I see a more range-bound move in bonds, give or take the occasional dip or rebound.
This is my bias for now. Anomalies can occur. Cycles can contract, extend and invert
In case you haven’t noticed, I post various charts in the Substack notes every week. You can find them all here. (click on the link)
👉 My mid-year stock market review is scheduled for next week’s newsletter.
P.S.: Occasionally, I share new analyses exclusively for free subscribers. Subscribing gives you email updates on these posts, plus extra insights and deeper research from the time you join onward; past analyses are not included.
If you liked this post from @Fiorente2’s Blog, why not restack and share it?
© 2008–2026 Fiorente2.com. All Rights Reserved.
Disclaimer: This analysis is for informational and educational purposes only and should not be considered investment advice. Read our full disclaimer.
Disclosure: From time to time, I may hold positions in the securities mentioned.
AVWAP (Anchored Volume-Weighted Average Price): the average price paid since a chosen anchor point, weighted by volume. It acts as a dynamic support and resistance level from that anchor forward
Your analyses enrich my studies on astrology thanks
Grazie, nessuno fa analisi su questi strumenti (BOND), perche hanno un comportamento difficile da decifrare, ottima analisi, sei il migliore.