
The Baltic Dry Index and the global economy
Is the Baltic Dry Index a good indicator for the global economy?

Introduction
This morning I was researching the Baltic Dry Index (BDI), and I was one of many in the world looking at this index simultaneously. I saw a tweet from Inside the Candle, and Sergey Tarassov, Owner and developer of Timing Solutions software, was also looking into this index. So, I decided to publish my analysis you can read below.
What is the Baltic Dry Index (BDI)
The Baltic Dry Index (BDI) measures the cost of transporting raw materials such as coal, iron ore, and grain by sea. It is published daily by the London-based Baltic Exchange and reflects the cost of shipping goods from one port to another. The BDI is considered an important economic indicator because it reflects the demand for shipping capacity and the supply of ships available to meet that demand.
It is an interesting index as the cost of shipping raw goods can reflect the state of the global economy. Worldwide limited ships are available to transport goods, so when the economy is good, the demand for goods will rise, the cost of shipping will increase, and vice versa. A rise in the index suggests an increase in the demand for goods relative to the supply of ships available. A fall in the BDI is seen as a sign of decreased demand for goods and raw materials, which often signals an economic slowdown.

However, it's important to note that the BDI is not a perfect indicator of the state of the global economy. It is a specific measure of the cost of shipping dry goods and does not reflect the price of shipping other types of goods or services. Additionally, the BDI can be influenced by factors such as weather conditions, geopolitical tensions, and supply chain disruptions, which can impact the supply of ships and the cost of shipping goods.
Stock Market Correlation
The chart below shows a small correlation between the Baltic Dry Index with the overall Stock Market (DJIA in this example).
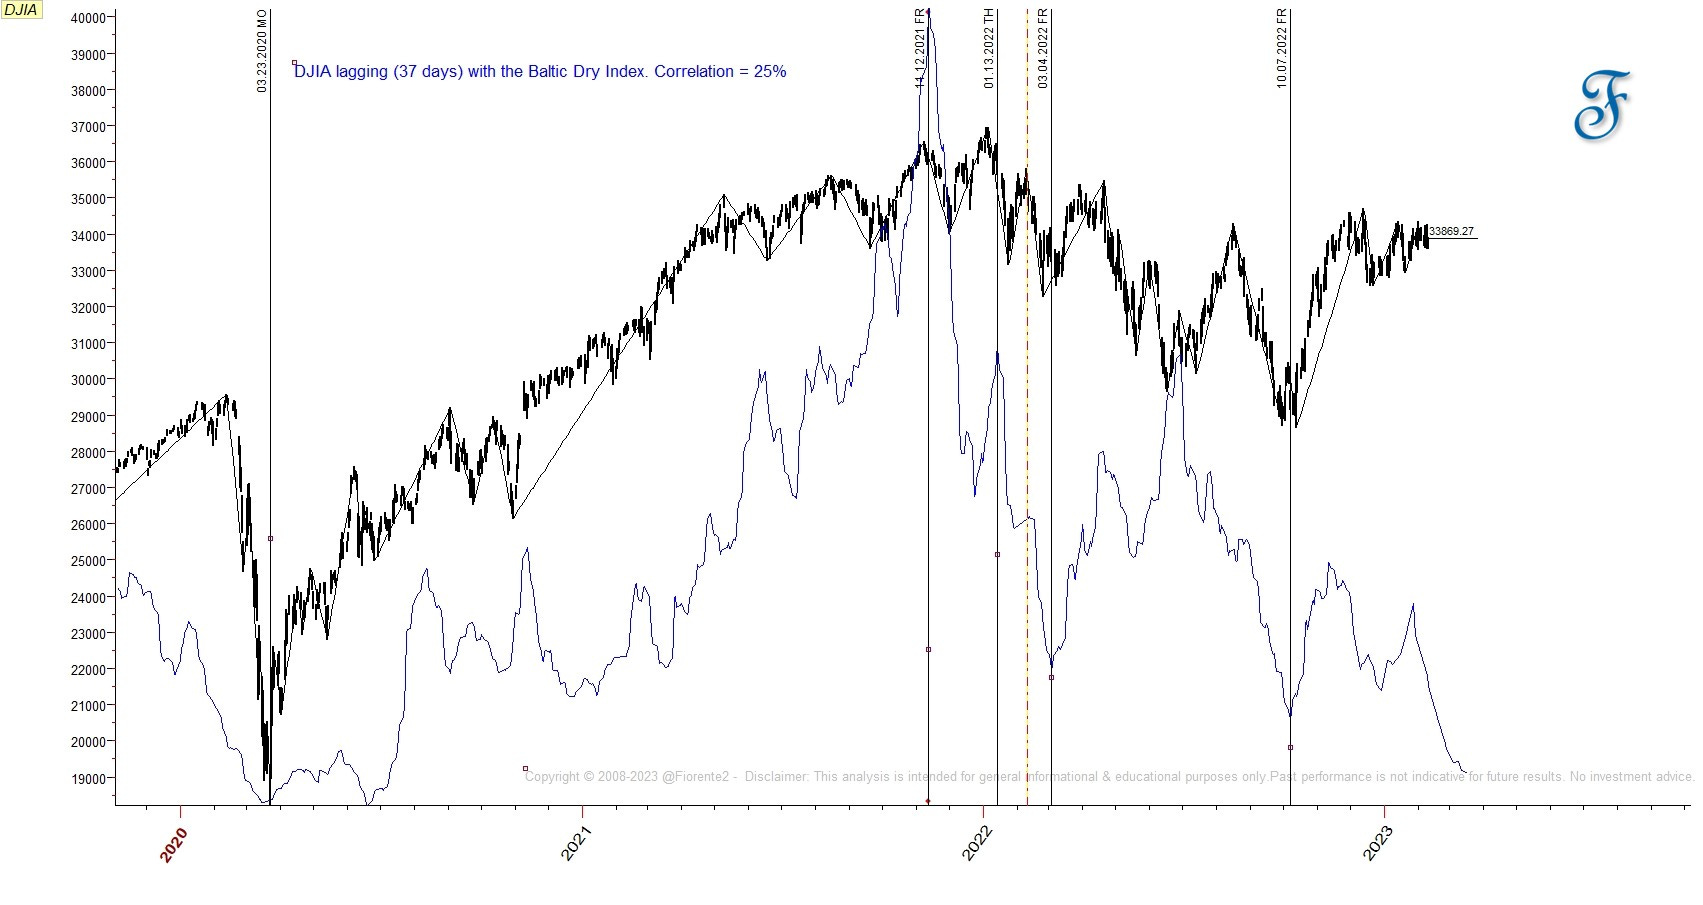
In general, a rising BDI is seen as a positive sign for the stock market, as it suggests an increase in global economic activity and demand for goods, which can lead to higher corporate profits and stock prices. On the contrary, a falling BDI is seen as a negative sign for the stock market, as it indicates a slowdown in global economic activity and reduced demand for goods. This can lead to lower corporate profits and stock prices.
The chart analysis shows that the DJIA lags behind the Baltic Dry Index. In addition, before the COVID crash in February-March 2020, the BDI was already declining to the low of March 23, 2020, but there may be other reasons for it than an economic slowdown. Worldwide there was an oversupply of new ships coming from the wharves in 2020, and the COVID period was also a standstill for some time in the global supply chain.
So, it's important to note that the BDI is just one factor among many that can impact stock market performance, and it should not be relied upon as the sole indicator of future stock market performance. Other factors, such as interest rates, geopolitical tensions, supply chain issues, and company-specific news, can also significantly impact the stock market.
In conclusion, the Baltic Dry Index can provide some insight into the state of the global economy and future economic trends. Still, there may be better forecast indicators for future stock market performance. It is just one of many factors that can impact the stock market and should be considered in conjunction with other indicators and market analysis.1
For our premium subscribers, I have made an extra chart that may forecast the future path of the BDI and where a low can be expected. Whether or not this will be an indicator of the overall stock market's future performance is to be seen.
This analysis is intended for general informational & educational purposes only. Hypothetical or simulated performance based on past cycles has many limitations. Cycles can contract, extend, and invert. Anomalies can occur. Hence, past performance is no guarantee for the future. No advice. Please take a look at our full disclaimer.