

Introduction
In this week’s edition, I am launching a new series of reports on equities approaching critical technical junctures. I am tracking stocks at key resistance and support levels, approaching time-cycle confluences, and moving into a position where price and time are in balance. Following a “keep-it-simple” approach, I will post one to two charts per equity with a short commentary.
The focus this time: LULU, TSLA, MSTR, SNOW, and NKE
Lululemon Athletica (LULU)
During yesterday’s presentation of Lululemon’s (LULU) Q2 2026 results, Lululemon reported a 4% decline in revenue and a 9% decrease in sales. The stock plunged more than 20% this morning.
LULU has been trading lower since December 2023, and the end of the downturn may not be in sight yet.
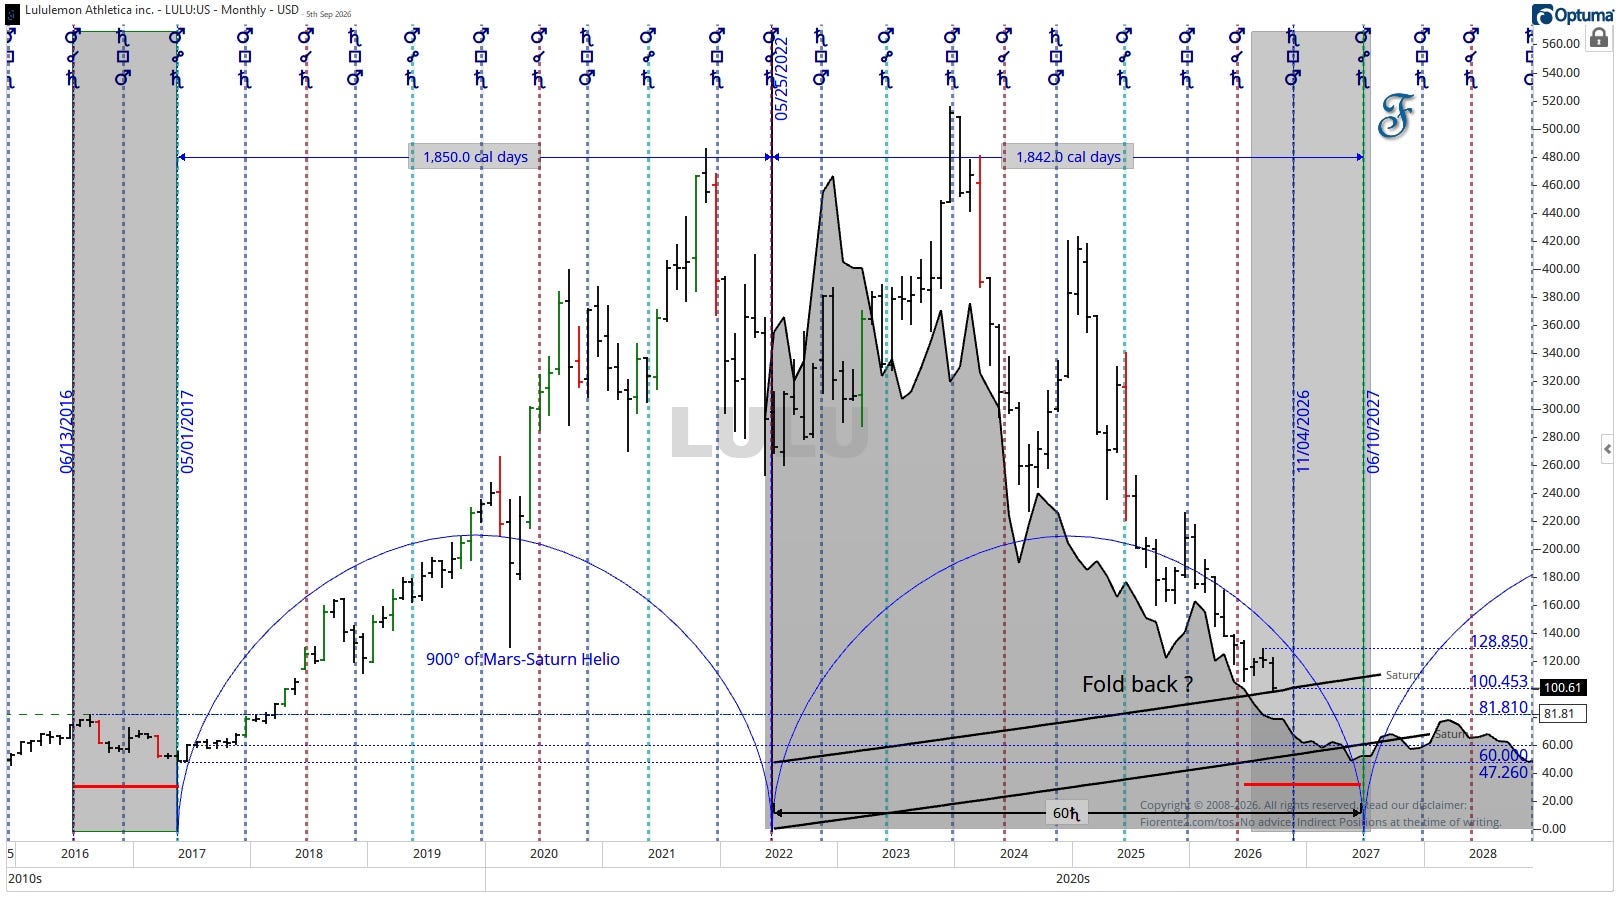
LULU is trading around the $100 price level, coinciding with the higher Saturn timing line drawn from the $47 midpoint.
This may provide support for some time, but based on the time-cycle geometry from the 2017 lows, I expect Lululemon to follow a classic decennial pattern within a five-year up-and-down cycle. A second support line may be found between $47 and $81, with a $60 price target as a potential low. A $60 tag would imply a $1 monthly move over 60 months, starting at zero, from the midpoint in May 2022. A monthly close above the $128.85 would put this lower scenario on hold.
The remaining part of this post is available for all free subscribers (no paywall).