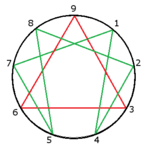
On last July 1st I wrote about my Venus Retrograde (Rx) thesis using the S&P500 as an example. See my earlier post on Twitter.
The lows in 2002 and 2009 were both smack on Venus Rx with 333 weeks between both bottoms. The question I asked myself was will the Stock market again turn on the next Venus Rx? If Venus goes Rx on December 19th 2021 (Sunday) that will be 666 weeks from low 2009 and 999 weeks from low 2002. The numbers 3(33), 6(66) and 9(99) on the enneagram form thus a perfect triangle on a circle, suggesting a cycle has completed.
There are several other harmonics in price and aspects of the number 6.66 at the same time that seem to suggest this thesis might be worth considering.
S&P 500 probable target in price and time
In July I wrote in my tweet that I was expecting probable high anywhere between 4365 - 4635 with a 3% orb @ the confluence of the 1.618 pitchfork extension line late December 2021. On September 2nd we have reached a high of 4545.85 which was right in the middle of that orb already, but still a few month short of my time target in December 2021 around Venus Rx. It seems like the high could have set in already.
Looking around the date of Venus Rx (Dec 19th 2021) I see that are several other cycles of interest that still can hint at a (second) top in December, such as on:
Dec 14th 2021 Venus is @ 66.68° H(elio) (1/10 of 666.79 low 2009).
Dec 18th 2021 Sun H Venus H returns at the exact same degree @ 13.1606° and 2880° (8*360°) away from the low of 2009. Note: Sun H Venus H was at 13° separation on the low of October 2002 as well.
Dec 21st 2021 Sun Mars returns to the same 141.3839° H as on the low of March 2009. Note: Sun H Mars H aligns every 2160°(6 times 360°) with Sun Venus at the exact same degree.
Dec 24th 2021 Saturn 090° Uranus. It’s third and last passage since February 2021.
Dec 24th 2021 Jupiter 18° Saturn. This is also the third passage of this aspect in 2021. According to professor Weston’s theory (1921) on the 20 year cycle the stock market goes to maximum height in the first year of the new decade when the distance is about 18° between the Jupiter and Saturn1.
Fibonacci perspective on a 2021 high
From a yearly perspective a high in 2021 would form also an ideal Fibonacci relationship between the years 1932, 1966 and 2021
Any high in December 2021 is 89 years from the low in 1932, 55 years from 1966 and 1966 is 34 years from 1932 making a perfect (89/55/34) Fibonacci symmetrical triangle. Same with connecting the years 1932, 1987 and 2021 which are subsequent 89/55/34 Fibonacci years apart.
Conclusion
As I did not even mention the Gann Master Cycle unfolding at the same time, the third passages of both Saturn square Uranus and Jupiter 18° Saturn, these cycles have all fed into my believe we could still have a (second) top somewhere around December 2021.
I can be wrong. The financial markets are complex. Cycles can contract or extend. Anomalies can also occur such as war, budget deficits, covid pandemic continuing. So take care. Trade the chart in front of you as the market develops.
Read my disclaimer. Disclosure: no positions in this index at the time of writing.
Forecasting The New York Stock Market, Prof. Weston 1921


Great job on the cycle work