
Reflecting on my 2025 Forecasts
#285 Looking back on last year's forecasts for the DJIA and S&P500

Introduction
In this post, I will take a closer look at the forecasts made in the Fiorente2 Stock Market Outlook 2025. By using the 60-year Gann Master cycle, I aimed to forecast how the DJIA and S&P 500 would perform. Now, it’s time to see how accurate those forecasts were and how they relate to what actually happened in the market. I’ll also discuss some of the patterns we've seen and what they might mean for the future. Let’s dive in and explore the outcomes from the past year.
My forecasting method, based on the 60-year Gann Master Cycle, uses the same patterns and volatility that occurred 60 years ago. It may sound absurd, or even impossible, that cycles and patterns repeat over such a long period, but it does to some extent.
Themes in society often repeat every 60 years. You can observe this in fashion, art, music, the stock market, and many other areas of life. Sixty years ago, automation made significant progress in society, and today we are seeing the next step: artificial intelligence.
As mentioned in my previous post, the sixty-year cycle is considered to be the most important cycle, as most of the planets that our weekdays are named after return to approximately the same position on the zodiac. Moreover:
So, let’s review what my forecast was exactly 1 year ago on December 20th, 2024.
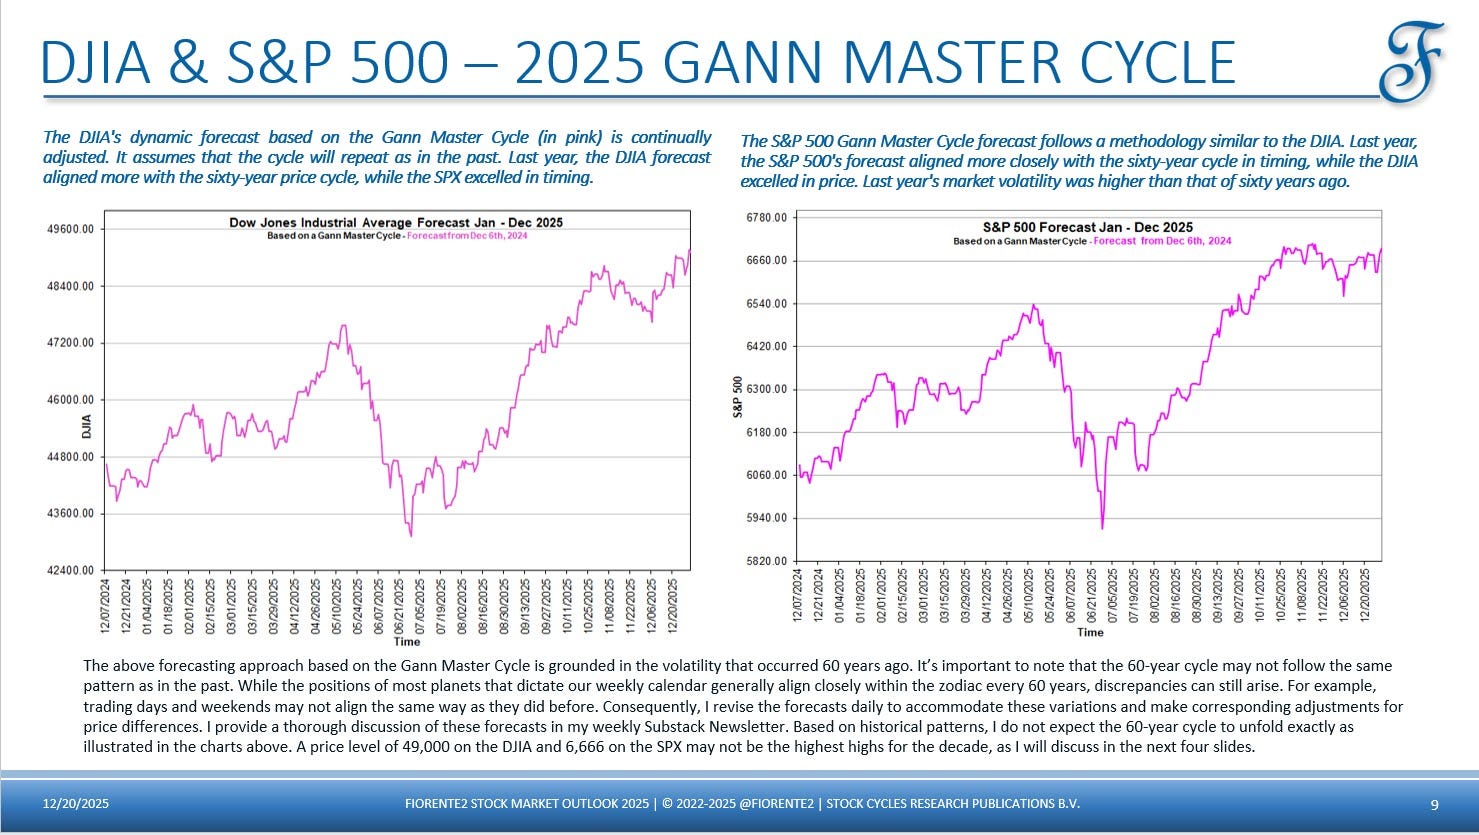
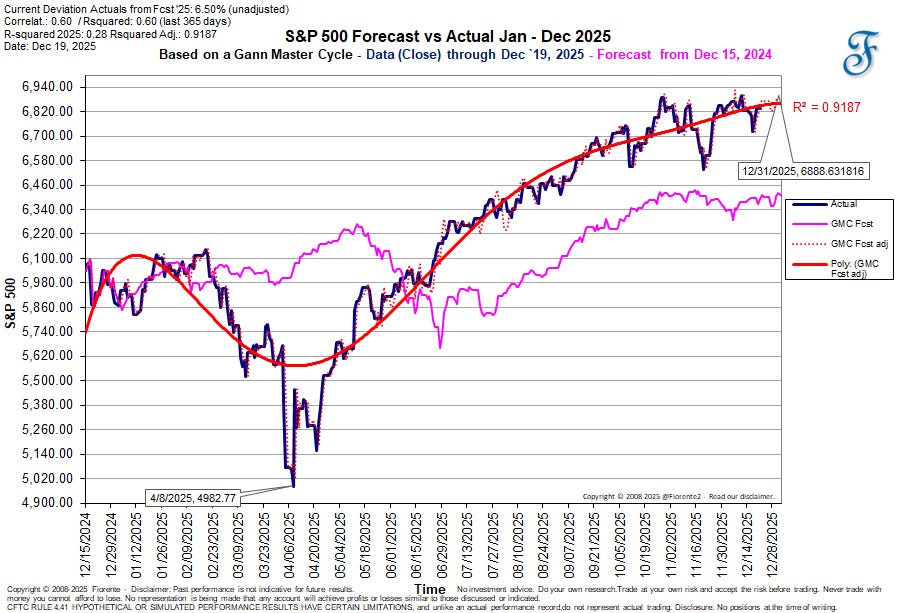
As you can see, I made a forecast for the DJIA at around 49,000 and the S&P 500 at around 6,660 by the end of 2025.
We might be closer to the DJIA forecast than to the S&P 500, which is nearly 7% higher as of last Friday. An interesting fact is that the May-June crash of 1965, caused by unexpected tariffs on automobiles, in 2025 happened on a much larger scale just a few months earlier.
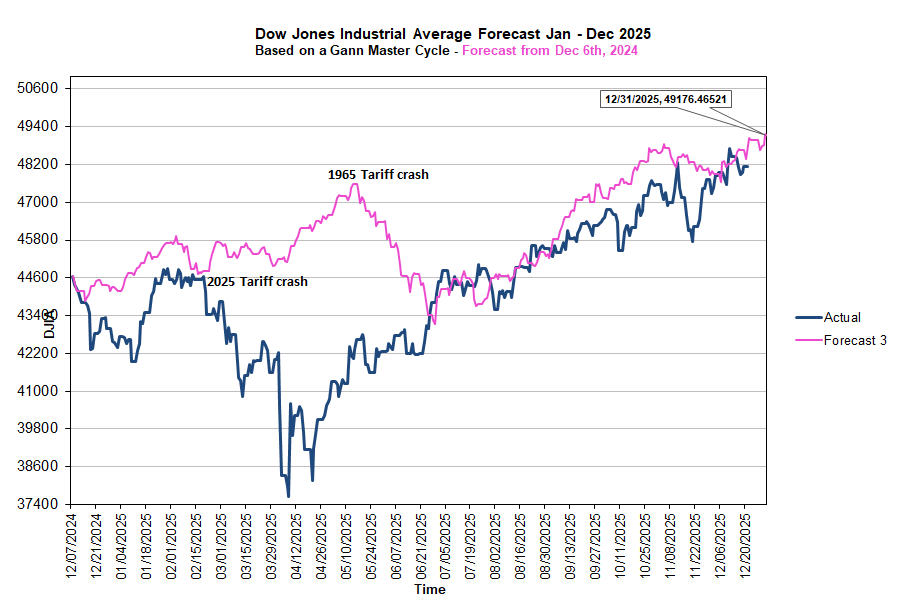
The above forecast for the whole year does not have a strong correlation due to the dip in March and April. The correlation improved to 80% when the forecast was offset from May 2025 to February 2025, as I already showed in a previous post.
The correlation improved after April, and premium subscribers to the previous paid forecast have seen that I maintained my projections based on a dynamically adjusted forecast, with confidence of 80% or more. Below is the latest dynamically adjusted forecast (red bold line).
In both 1965 and 2025, the markets panicked over a similar issue: tariffs.
This cycle doesn’t always follow the same pattern or volatility, and when inversions occur, it might be wise to look back 120 years (twice the 60-year cycle).
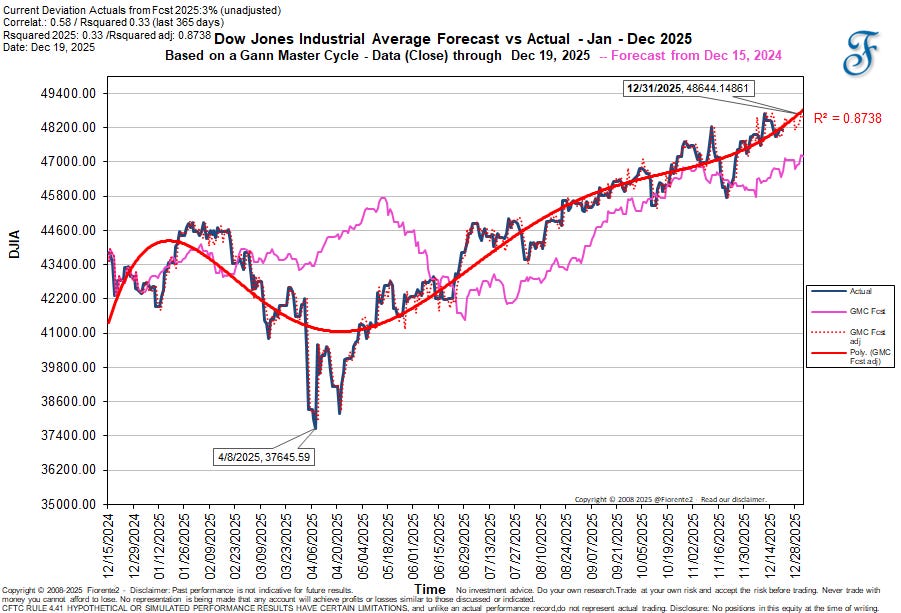
Similar story for the S&P 500. Below, you’ll find my static forecast from last year, made a full year ago.
The overall 2025 correlation of the S&P 500 is much higher than that of the DJIA, since the S&P 500 is currently more important (along with the Nasdaq) than the DJIA, which was the more significant index 60 years ago.
Other remarkable similarities with past years
Using a yearly spiral chart in last year’s publication, I discussed the USA 1776 and the NYSE 1792 yearly charts as shown below. You can click on the chart to expand it for better readability.
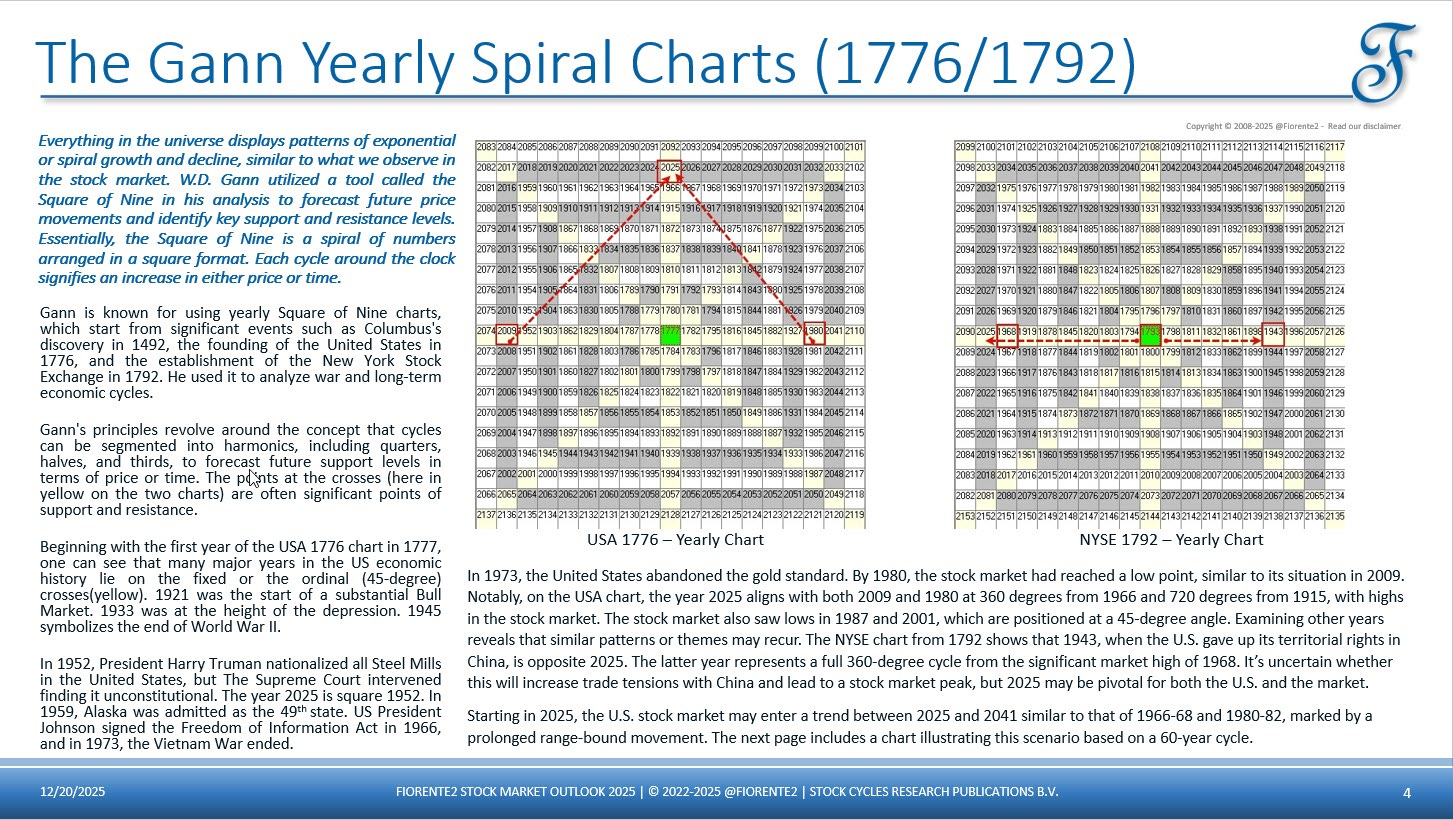
Based on the above analysis, I expected steel to become a prominent theme in 2025, as it was in 1952, when President Harry Truman attempted to nationalize all steel mills. The year 2025 mirrors 1952. On June 18, 2025, Nippon Steel completed its acquisition of U.S. Steel, with the U.S. government obtaining a golden share and significant control over the company. This is almost as if US Steel was nationalized. A similar pattern repeats.
The NYSE chart from 1792 indicates that 1943, when the U.S. relinquished its territorial rights in China, is opposite 2025. I wasn’t sure if trade tensions with China would recur, but they did return in 2025, and like in 1943, the tensions were eventually eased. Since 2025 aligns with the USA 1776 spiral chart along with 1980 and 2009, I expected the U.S. indices to hit a peak in 2025, unlike in these previous years.
Note: In my annual publication “Fiorente2 Stock Market Outlook 2025”, I made many other forecasts, such as on Wheat, Crude Oil, Natural Gas, Gold, Silver, BTCUSD, ETHUSD, US 2Y Treasury Note, US 10Y Treasury Note, US Dollar Index, EUR/USD, and World Indices. Some forecasts were good or partly good and/or still on track; others were really underestimated, such as Gold and Silver.
I will not publish a Fiorente2 Stock Market Outlook for 2026 as I have in previous years. However, when time permits, I will update my annual forecasts for these commodities and indices here on Substack and include a review of the 2025 forecast.
Conclusion
In today’s analysis, I have revisited my 2025 annual forecast on the US Indices. I have included my updated dynamic forecast for the DJIA and the S&P 500 through the end of the year. As in all my publications in the last few years, I showed in today’s post that the US Indices follow the 60-year cycle. Not always in the same pattern, likely due to the faster-moving planets (Venus or Mars) than the slower-moving planets (Jupiter, Saturn, or Uranus) that set the overall trend.
In addition, I showed that, by using the Gann Yearly Spiral chart concept and looking back at important years that create harmonic connections, one could find themes that recur or have the opposite effect. The year 2026 is going to be interesting again. I will publish my full Master Cycle forecast for 2026 for the US Indices, exclusively for all free subscribers, around the New Year.
If you would like a glimpse of what I expect for the first few months, you should review my previous post (click on the link). In this forecast, the medium-term cycles within the pink composite cycle on the DJIA also confirm the potential for a more range-bound move into early February 2026.
I am still keeping an eye on the 18.6-year cycle, which may not drag the US Indices into a crest in April/May 2025. Whether the 18.6-year cycles come in at the expected time, as mentioned in my earlier post, remains to be seen. This cycle can also come in early, aligned with the 60-year cycle.
This is my bias for now. Always keep in mind that cycles can contract, extend, or invert, and anomalies can arise. So, be careful out there. No advice.
In case you haven’t noticed, I recently posted some extra charts in the Substack notes. You can find them all here.
P.S.: Occasionally, I share new analyses exclusively for free subscribers. Subscribing gives you email updates on these posts, plus extra insights and deeper research from the time you join onward; past analyses are not included.
If you liked this post from @Fiorente2’s Blog, why not restack and share it?
© 2008–2025 Fiorente2.com. All Rights Reserved.
Disclaimer: This analysis is for informational and educational purposes only and should not be considered investment advice. Read our full disclaimer.
Disclosure: From time to time, I may hold positions in the securities mentioned.