
Planetary Transits and 60-Year Cycle Analysis - part 2
#186 An update on the US Indices: DJIA, S&P500 and Nasdaq.

Introduction
This week, quite a few notable earnings may have brought the US Indices back on track. Based on my research on the 60-year cycle, I already expected the US indices to return to their 60-year cycle path after the pullback from March 21st to April 19th, 2024.
Although the correlation between the 60-year cycle and the DJIA and S&P500 is still high, the magnitude is lower, so I remain cautious. With much unrest in the world, any unexpected event could trigger the US Indices further downwards.
While the markets were open, I wrote this update for the premium subscribers on Friday morning US time, which is always challenging as unexpected moves during the last trading day of the week might jeopardize my writing.
In particular I was a bit concerned about the below triangle seen in the 60 minute chart of the S&P500. A downward breakout would probably mean the downturn from March 21st, 2024 was not over yet. Luckily, it did not happen.
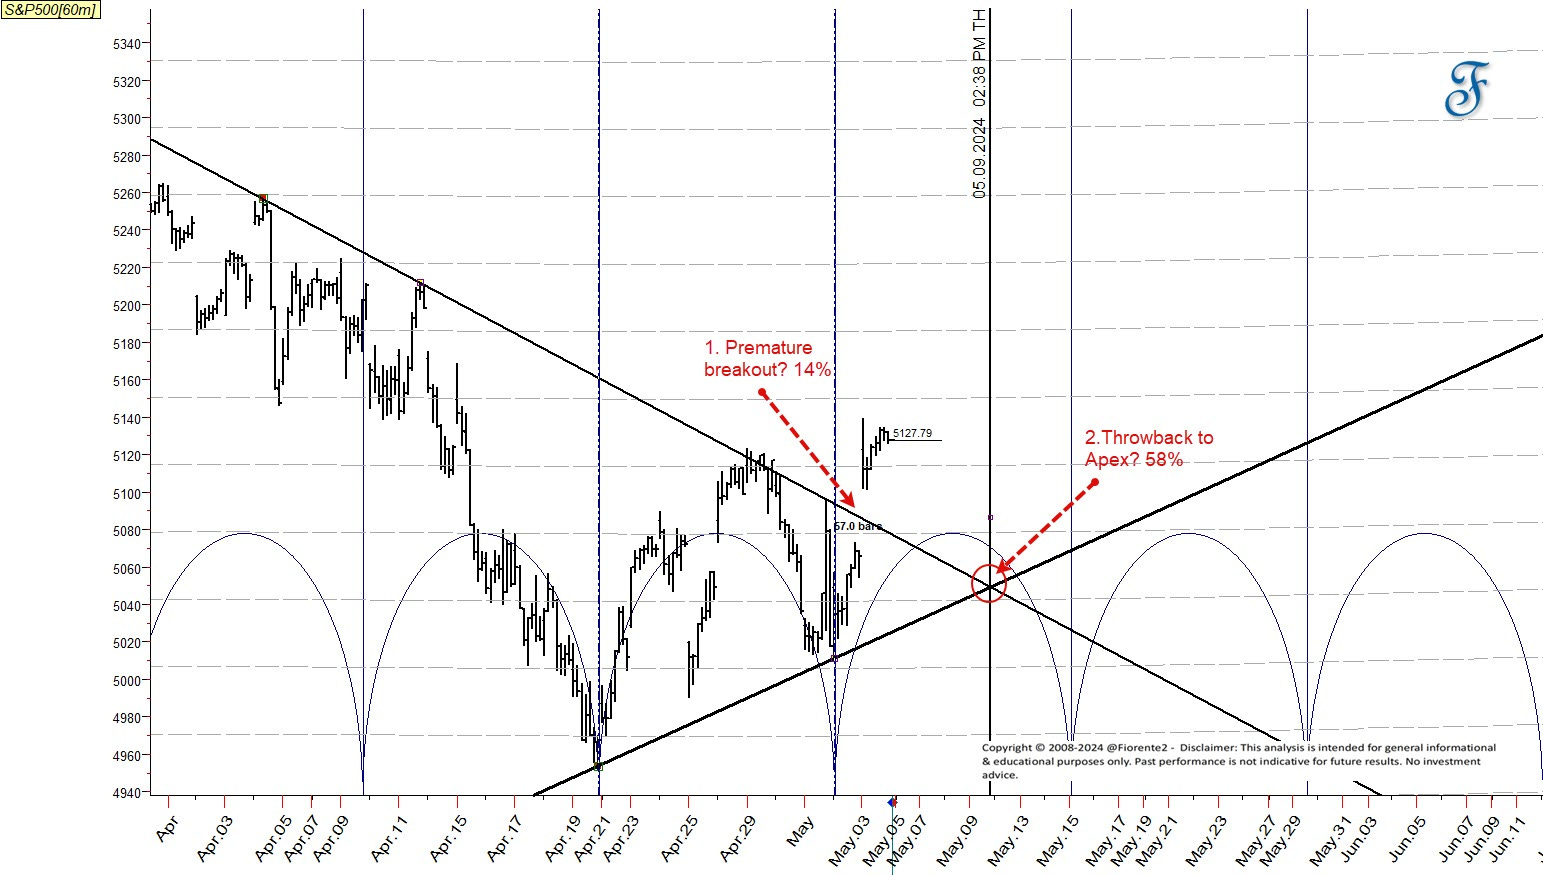
According to the research of Thomas N. Bulkowski1 a premature upward breakout as seen in the above symmetrical triangle is seen in 14% of the cases. However, he saw in 58% of the cases after the breakout a pullback to the apex of this triangle. The probabilities of a failure rate for this pattern is 5%.
The premium subscribers can read on from here.