
Nike's Steep Decline Continues: Where Will It Bottom?
#298 Squaring Price and Time to forecast NKE's potential low

Introduction
Nike, Inc. (NKE) continued its steep decline amid concerns over weak US/China growth, margin pressures, and fears of a turnaround delay. Where will the stock find a bottom?
Wall Street price targets usually won’t help. As Michael Burry recently noted: “Wall Street over the last 10 years guided investors to 42% more earnings than ever actually existed.”
They also won’t tell you when the bottom has arrived, and they start buying again.
Squaring Price and Time
What I’ve learned is to look for a moment where Price and Time align. As W.D. Gann noted, when Price and Time are in balance, there’s a greater probability for a change in trend.
“This is one of the most important and valuable discoveries that I have ever made, and if you stick strictly to the rule and always watch a stock when Price is squared by Time, or when Time and Price come together, you will be able to forecast the important change in trend with greater accuracy. The squaring of Price with Time means an equal number of points up or down, balancing an equal number of time periods.” - W.D. Gann Stock Market Course.
Time can be expressed in equal or harmonic numbers of days, weeks, months, or planetary degrees.
Three Ways to Square Time and Price
According to Gann, there are three ways:
“Square the Range (points from extreme low to extreme high) with Time, then square the extreme low point with Time, and square the extreme high point with Time. When the market passes out of these squares and breaks important angles, the trend changes up or down.”
Squaring the High and the Low on Nike
Applying this to NKE: From the November 2021 top, the harmonic numbers may tell a story: the 179.10 High squares at 1791 calendar days, and the 9.56 Low balances at 956 Mars Helio degrees.
This gives a potential time band between September 28, 2026, and October 1st, 2026, for my preferred time target at the Saturn 1x1 or 1x2 timing line.
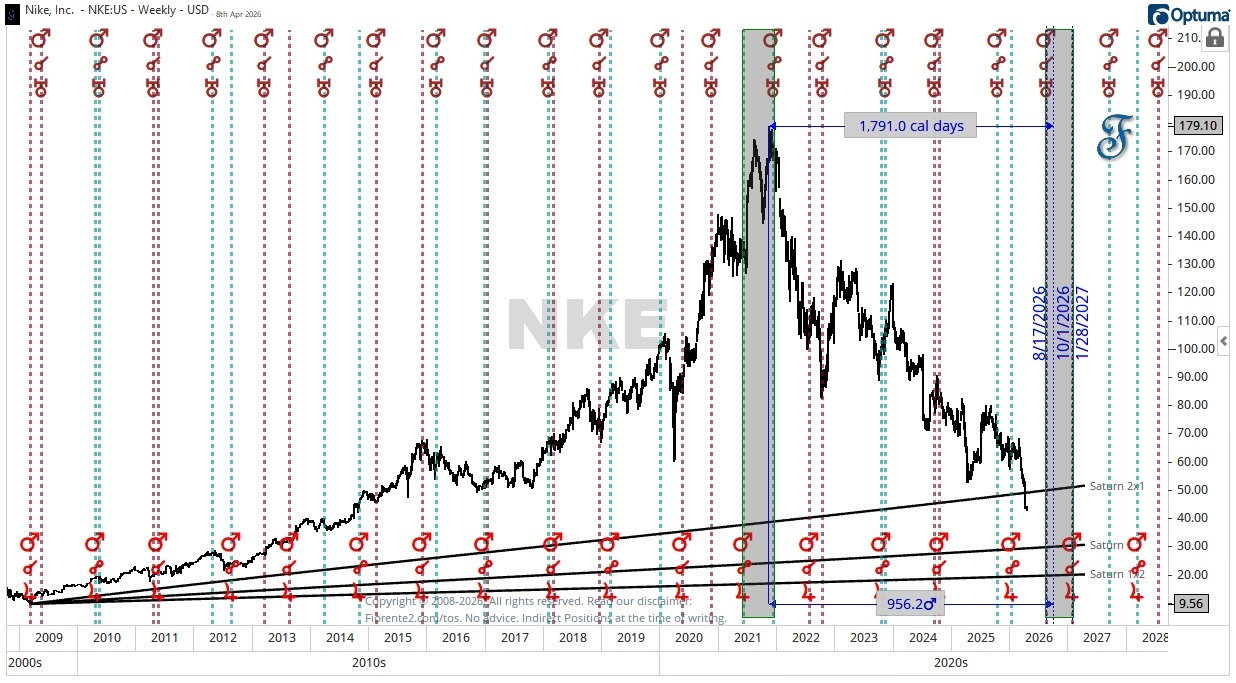
Of course, this is a forecast with a 70% probability, following the Mars-Jupiter Helio 816-day cycle over the last 12 cycles, and it may come in as late as the end of January 2027. As the decline started at a Mars-Uranus opposition, also watch the Mars-Uranus conjunction in mid-August 2026 for an early price and time alignment.
Conclusion
Nike’s potential decline to its 17-18 year low presents a case study in squaring Price and Time. The alignment of calendar days, planetary degrees, and Saturn timing lines suggests a window from as early as August 2026 to as late as January 2027.
My bias is for late September to early October 2026 as the primary window for a potential trend change.
Watch for price action around the Saturn 1x1 or 1x2 timing lines during these periods.
Remember, cycles may deviate or extend, and no forecast is certain. This analysis is for educational purposes—always do your own research and manage risk accordingly.
In case you haven’t noticed, I post various charts in the Substack notes every week. You can find them all here. (click on the link)
P.S.: Occasionally, I share new analyses exclusively for free subscribers. Subscribing gives you email updates on these posts, plus extra insights and deeper research from the time you join onward; past analyses are not included.
If you liked this post from @Fiorente2’s Blog, why not restack and share it?
© 2008–2026 Fiorente2.com. All Rights Reserved.
Disclaimer: This analysis is for informational and educational purposes only and should not be considered investment advice. Read our full disclaimer.
Disclosure: From time to time, I may hold positions in the securities mentioned.