
Markets in Recovery Mode: Are We Out of the Woods?
#259 An update on the main trends in the US Indices: S&P 500, Nasdaq 100, and DJIA.

Introduction
Markets in Recovery Mode: Are We Out of the Woods? Both European and Asian/Australian indices are trading above their daily and weekly breakout or reversal levels. In contrast, the US indices remain below their weekly thresholds. Will the US indices continue to trend after their recent pullback and align with movements in other markets? The upcoming weeks could be crucial as we near significant long-term and short-term inflection points.
Some time ago, I posted a tweet on X showing a chart with a potential Inverse head-and-shoulders pattern. You can review it here.
Although a foldback is never perfect, the US Indices may be trading back to the point where the US Tariff discussion started on February 19th, 2025. I made minor adjustments to the initial chart posted on X.
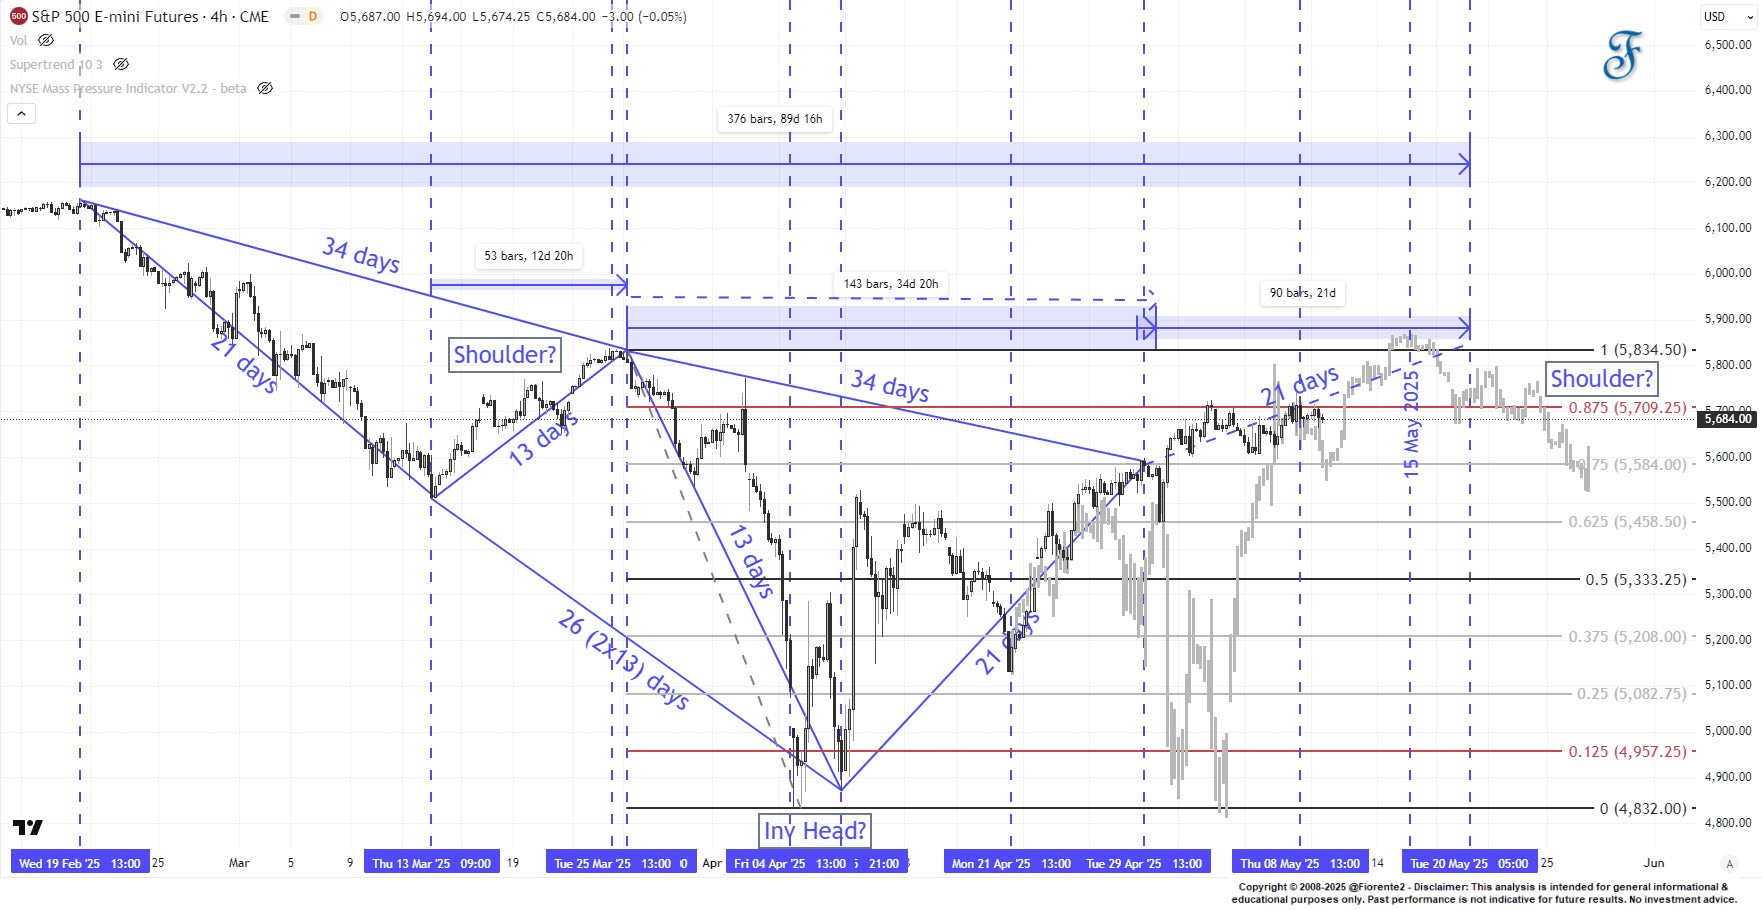
Currently, the S&P 500 E-mini Futures are bouncing against resistance. A breakthrough at the 7/8 level may bring the S&P 500 back to its March 25, 2025, high. We may stay at the current level until around May 19th, 55 days from the March 25 high. The chart shows that markets often trade in subsequent Fibonacci days, forming symmetrical triangles.
If the 99-year analog persists, as mentioned last week, we might have reached an inflection point. So, be careful. The market may make a correction along this cycle, which may be short-lived (if this cycle continues).
Will the markets remain in recovery mode? I have updated last week’s chart on the 99- and 60-year cycle analogs in this post. As shown in last week’s post, the markets may be facing various planetary inflection points in the coming weeks. These dates are important to observe, and the outcome may provide clues about whether the foldback will persist or the pullback has concluded.