
Gann Master Cycle update - Sept 16 2023
A Gann Master Cycle forecast following the DJIA, SPX, Nasdaq Composite & Nasdaq 100

Introduction
In my last week’s post, I wrote: “I have a great appreciation for mirror image foldback patterns.” 1
Foldbacks can work for a very long time, over many years, as seen in the below chart on WBA (Walgreens Boots Alliance).
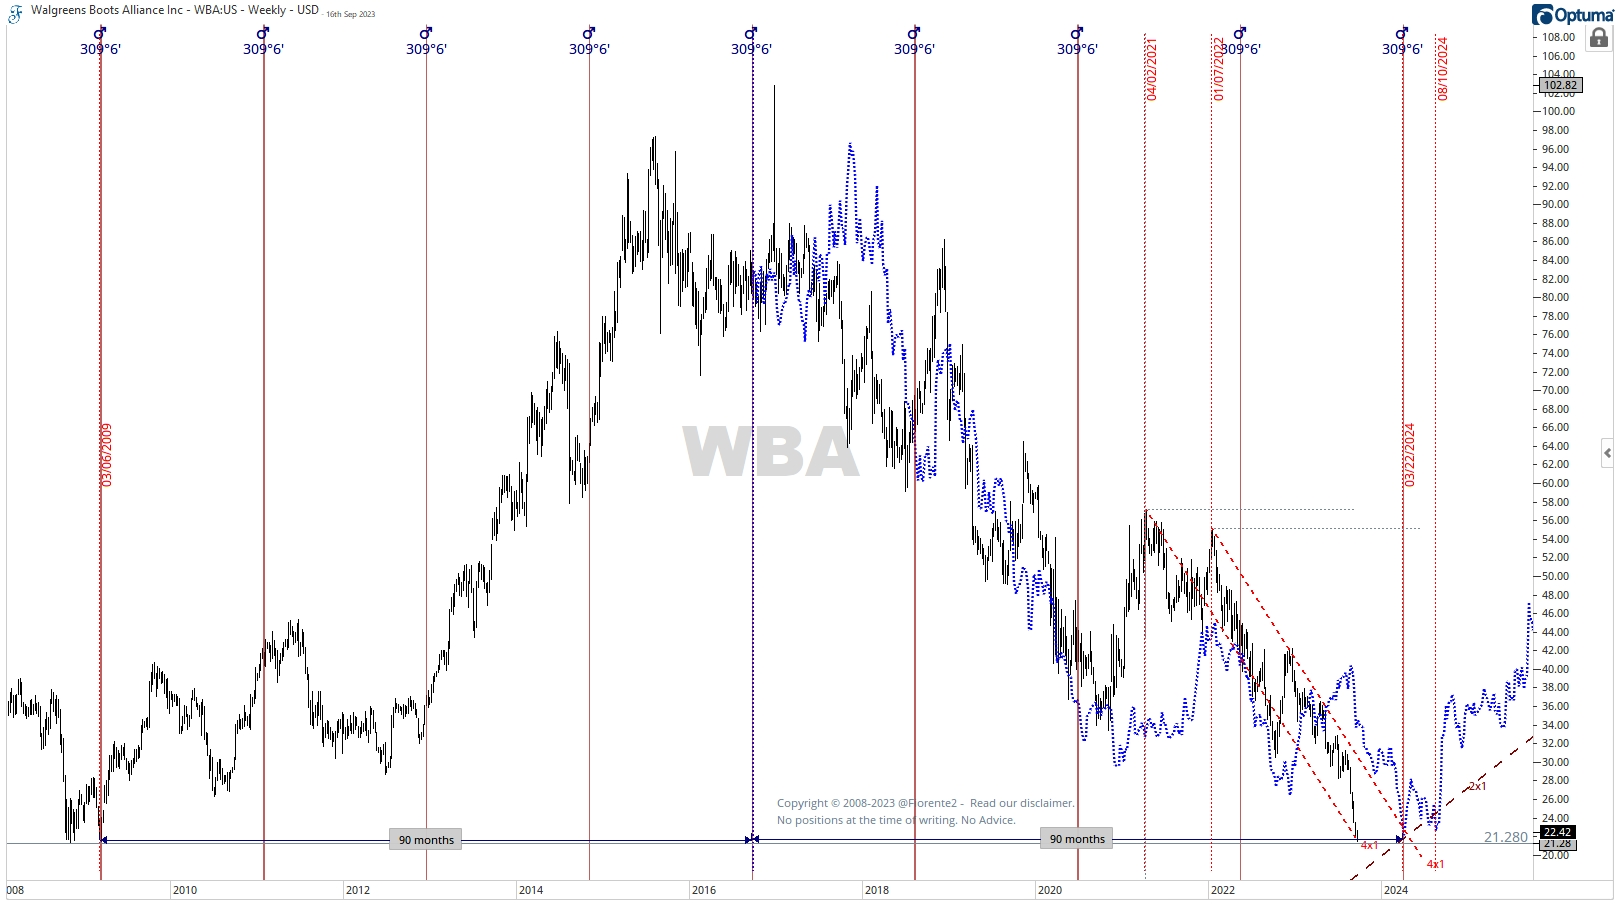
The foldback(blue dotted line) suggests that WBA may be close to a 15-year cycle low. This may be a significant low. A Mars Helio - a 22-month cycle- may confirm this analysis. The foldback pattern indicates a possible bottoming process in March-August 2024, which will then complete the 15-year cycle low. We are trading close to the March 2009 low price level of $21.28. Time is more important than Price, so I am watching the stock to first form a double bottom, similar to 2009, and finalize its 15-year cycle first, before considering a position, as we may have yet to see the final low.
I frequently use foldback patterns in my analysis. These patterns can also be effective in the short term when dealing with planets going retrograde and returning to the same planetary angle after they turn direct again. This often results in a mirror image foldback pattern. Given that Venus (September 4th, 2023) and Mercury (September 15th, 2023) have recently gone direct again, we may see more sideways movement shortly.
So, looking at the short-term fold-back patterns involving Venus and Mercury may hint at where the market may be heading. I have updated last week’s post on the DJIA, SPX, COMPX, and NDX for the premium subscribers below.
This analysis is intended for general informational & educational purposes only. Hypothetical or simulated performance based on past cycles has many limitations. Cycles can contract, extend, and invert. Anomalies can occur. Hence, past performance is no guarantee for the future. No advice. Please take a look at our full disclaimer.