Introduction
In the last update on BTCUSD update I wrote:
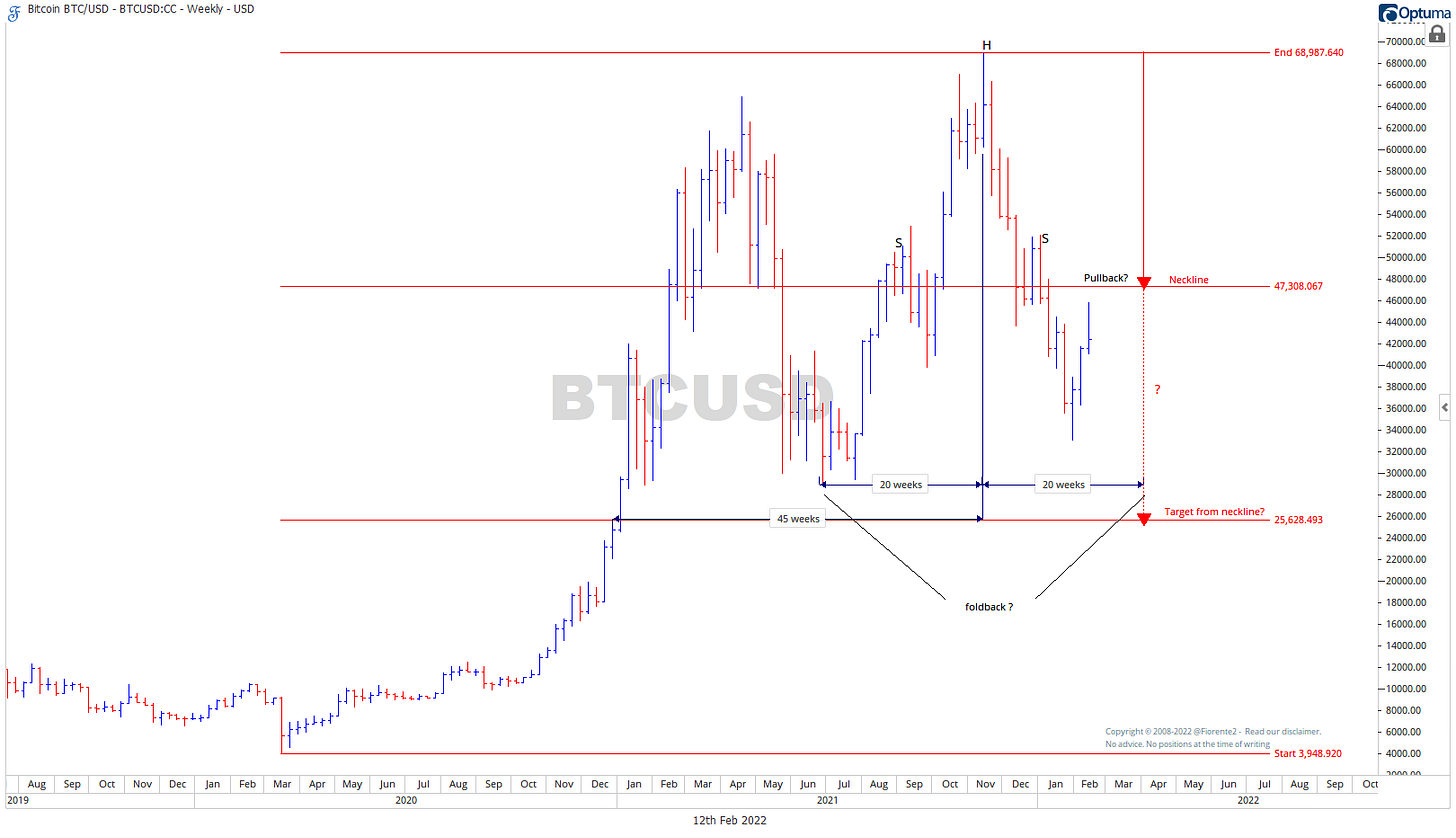
In the Stock Market Outlook (published on Gumroad) on page 35 I wrote about the probable path for BTC/USD in 2022 based on the foldback that seemed to be unfolding at that moment in time. The foldback or mirroring from the November 2021 crest, and back towards to the starting point where it came from is often seen when planets are on a retrograde(Rx) movement. So far BTC/USD has followed this path, will it continue?
You can see in below weekly chart the top is 45 weeks from the breakout early January 2021 which is an important time period, as W.D. Gann mentioned in his Stock Market Course:
"The weekly movement gives the next important minor change in trend, which may turn out to be a major change in trend." W.D. Gann Stock Market Course (1955)
Head & Shoulders pattern
In addition to this if you look closely we see a Heads & Shoulders top pattern unfolding, which is a kind of mirroring pattern unfolding from the crest.
Dividing the range from low 2020 to top 2021 in three parts, you can see the neckline on 2/3’s of the price range. So, in a Heads & Shoulders pattern you could expect $BTCUSD to go 1/3 from neckline to a baseline as a target for future support. This is right on the level where $BTCUSD really broke out early January 2021.
Although according to statistics1, the expected low for this Heads & Shoulder pattern may have been reached the price target, which is measured on 23% from neckline as an average decline as researched by Thomas Bulkowski.
Geometry and time perspective
If geometry and symmetry repeats the recent low seems perhaps to be too early in time. So, from a time perspective then I would not expect this pattern to be completed before end of February early March 2022. This is probably 20 weeks from crest, around end of February to mid-March 2022.
Our paid subscribers to the monthly update of our Stock Market Outlook 2022 on Gumroad have received a full complimentary update. For our paid subscribers on substack I will further discuss my more detailed analysis with a clear projection on the ideal price/time alignment for the expected low to occur. I may be wrong of course as unfolding patterns and Head & Shoulder patterns do have a failure rate. So, always watch the chart in front of you. No Advice. Past performance is no guarantee for future results.
Disclosure: No positions at the time of writing. Read our full disclaimer.


