

Introduction
BTCUSD has followed a parabolic trend channel formed by solid blue trend lines since the November 2022 low and may now be running out of time. Last Friday, on the 29th square in Price and Time, right on the parabolic trendline that has supported the market multiple times, volatility increased. When Price and Time are in balance, a change in trend may happen.
When equities are trading in a parabolic pattern, traditional technical analysis may not be the most effective way to analyze price trends and time targets. Parabolic trendlines could be a more suitable approach to pinpointing potential support and resistance levels in both price and time.
Subscribers may recall the (now updated) chart below from my posts on August 22, July 13, and March 17th, 2025.
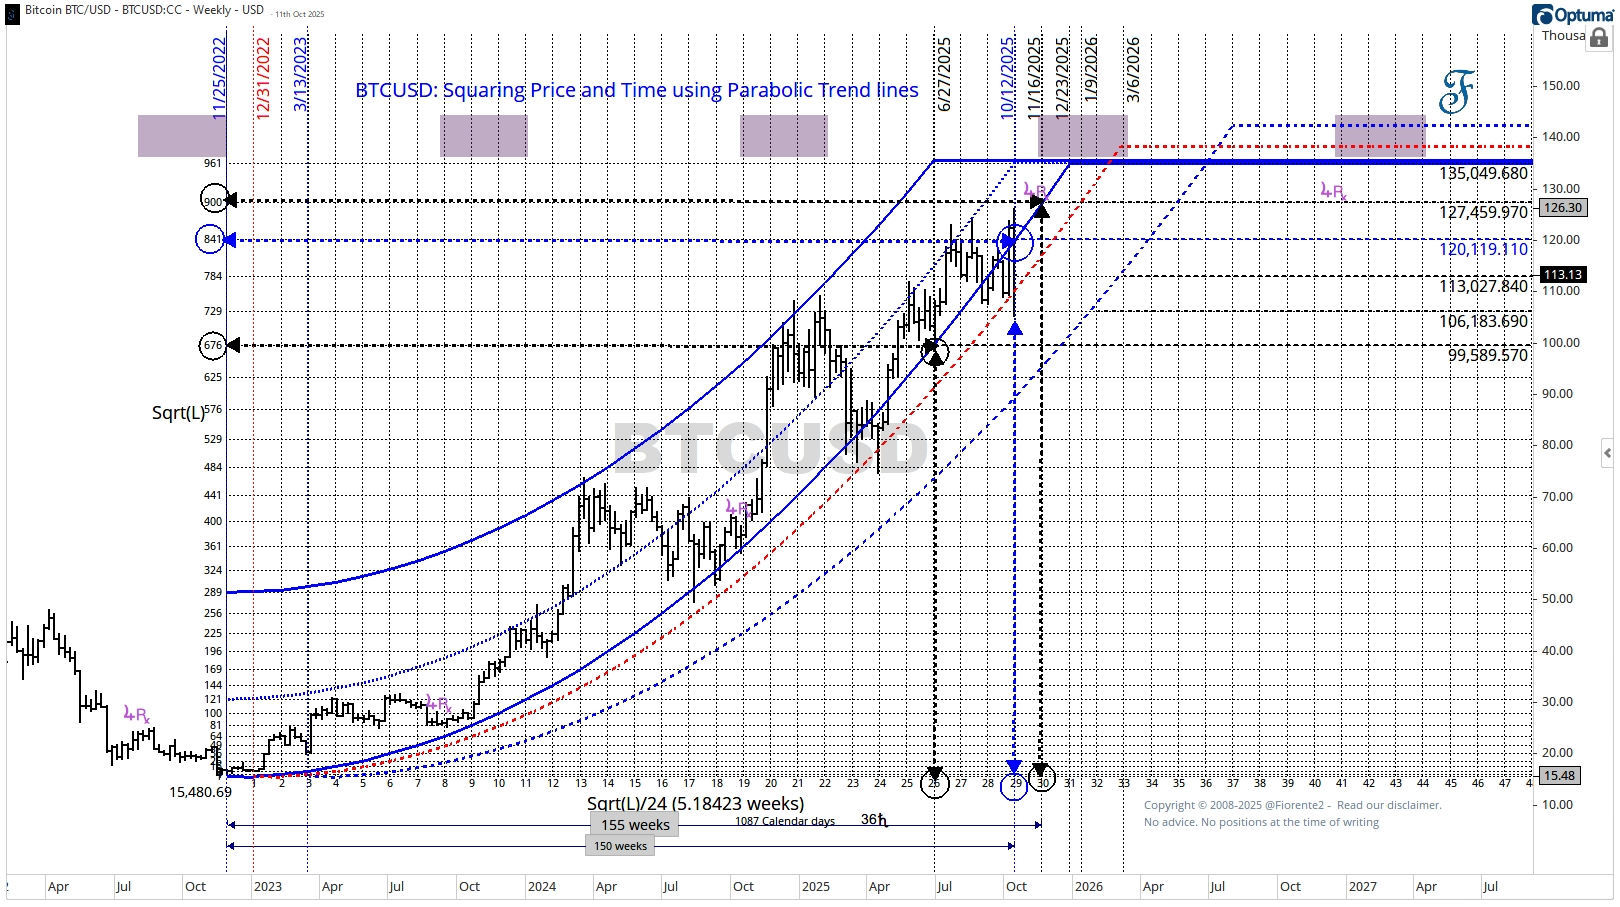
How is this parabolic trendline constructed? I defined time increments as the square root of the low divided by 24, since Bitcoin is traded 24 hours a day. A 24 harmonic. By squaring the time increments and multiplying them by the square root of the low, we derive the price component. Note that I have a weekly chart here.
The parabolic lines illustrate how prices can rise sharply over time due to the quadratic relationship between time and price. The model presented suggests an accelerating parabolic trend, with prices increasing rapidly over time.
Bitcoin is currently trading below the lower parabolic trendline, which is expected to balance price and time around $120,119.11 by October 12th, 2025. This suggests that Bitcoin may have completed its Price and Time cycle at the square of 29 or 150 weeks.
However, BTCUSD might have found support on the red dashed parabolic trendline, which roughly started five weeks after the November 2022 low. If this support persists and the uptrend continues, the next target in price and time, indicated by the square of 30, is set for November 16th, 2025.
This date is close to 1/100 of the low in weeks (15,480.69/100), or approximately 155 weeks—three years after the 2022 low—and corresponds to a 36-degree move in Saturn from a geocentric viewpoint. Note: Bitcoin’s uptrend started when Jupiter turned direct at the November 2022 low, and often the trend in Bitcoin reversed around these retrograde periods.
As long as Bitcoin remains above the lower parabolic trendline (the lower dashed red line) and continues to make higher lows and higher highs, an uptrend is likely to persist. However, we might be running out of time, considering Bitcoin is at the end of a 3-year trend. Following a 36-degree shift in Saturn and with Jupiter turning retrograde (Rx) by November 11, 2025, this could signal that Bitcoin (BTCUSD) is due for a change in trend.
This is my bias for now. Always keep in mind that cycles can contract, extend, or invert, and anomalies can arise. So, be careful out there. No advice.
P.S.: Occasionally, I share new analyses exclusively with free subscribers. Subscribing gives you email updates with these extra insights and deeper research from the time you join onward; past analyses are not included.
If you liked this post from @Fiorente2’s Blog, why not restack and share it?
© 2008–2025 Fiorente2.com. All Rights Reserved.
Disclaimer: This analysis is for informational and educational purposes only and should not be considered investment advice. Read our full disclaimer.
Disclosure: From time to time, I may hold positions in the securities mentioned.