
BTCUSD - Approaching critical juncture
#273 Insights into Parabolic Behavior and Planetary Influences on Future Price Movements

Introduction
Looking at BTCUSD's past price behavior, it's clear that Bitcoin prices can spike rapidly over time, often due to an exponential or parabolic relationship between time and price.
Because the relationship between time and price follows a parabolic pattern, traditional technical analysis might not be the best way to analyze price trends and time targets in BTCUSD. Parabolic trendlines could be a more suitable approach to pinpointing potential support and resistance levels in both price and time.
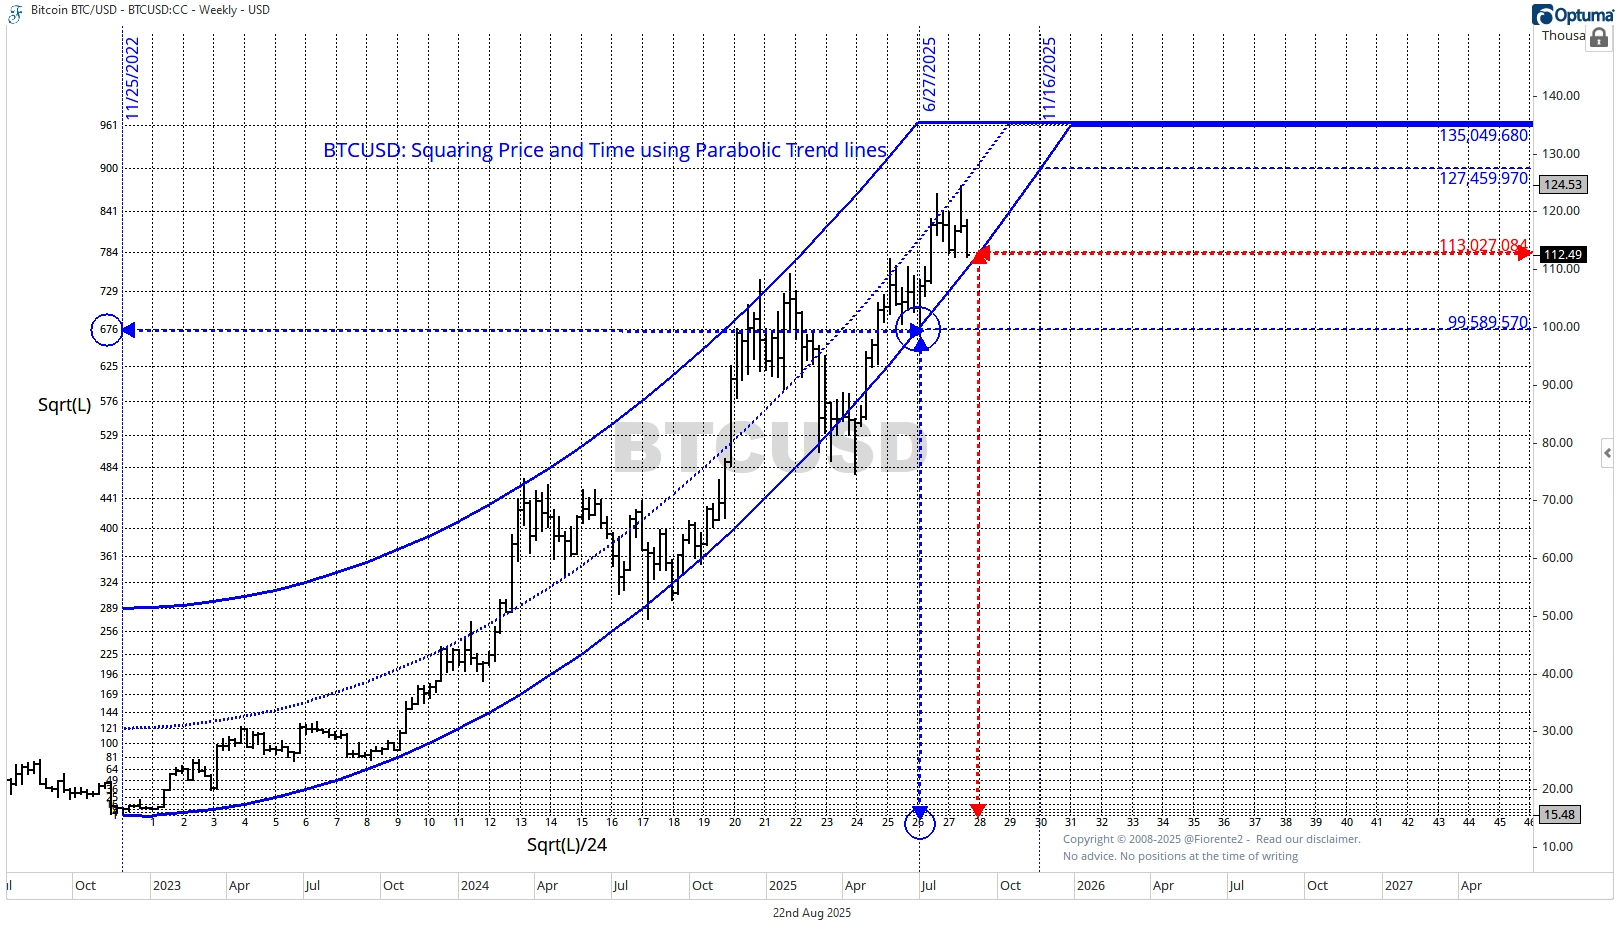
As a premium subscriber, you may recall my Subscribers' post from July 12, which updated my March 17th post. It showed BTCUSD trading within a parabolic trend channel where time and price align.
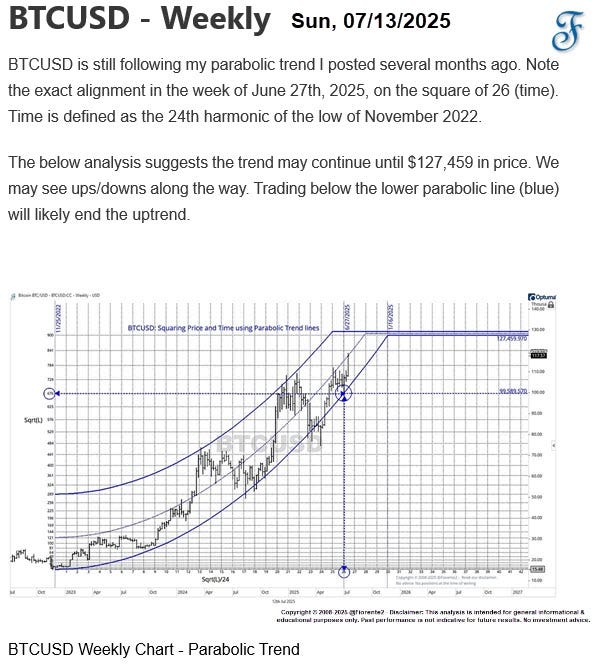
Looking at the parabolic lines, you can see how the price jumps quickly over time because of the quadratic connection between time and price. The model above shows an accelerating parabolic trend, with prices rising sharply as time passes.
How has it been going so far?
$BTCUSD is now approaching a critical price point and time close to the lower parabolic line. Will this serve as the support it needs? In the medium term, there could be more going on beneath the surface than is immediately evident.
There is a medium-term synodic cycle that indicates Bitcoin repeats or inversely repeats past behaviors at key Planetary Angles, as shown in the chart below with vertical lines.
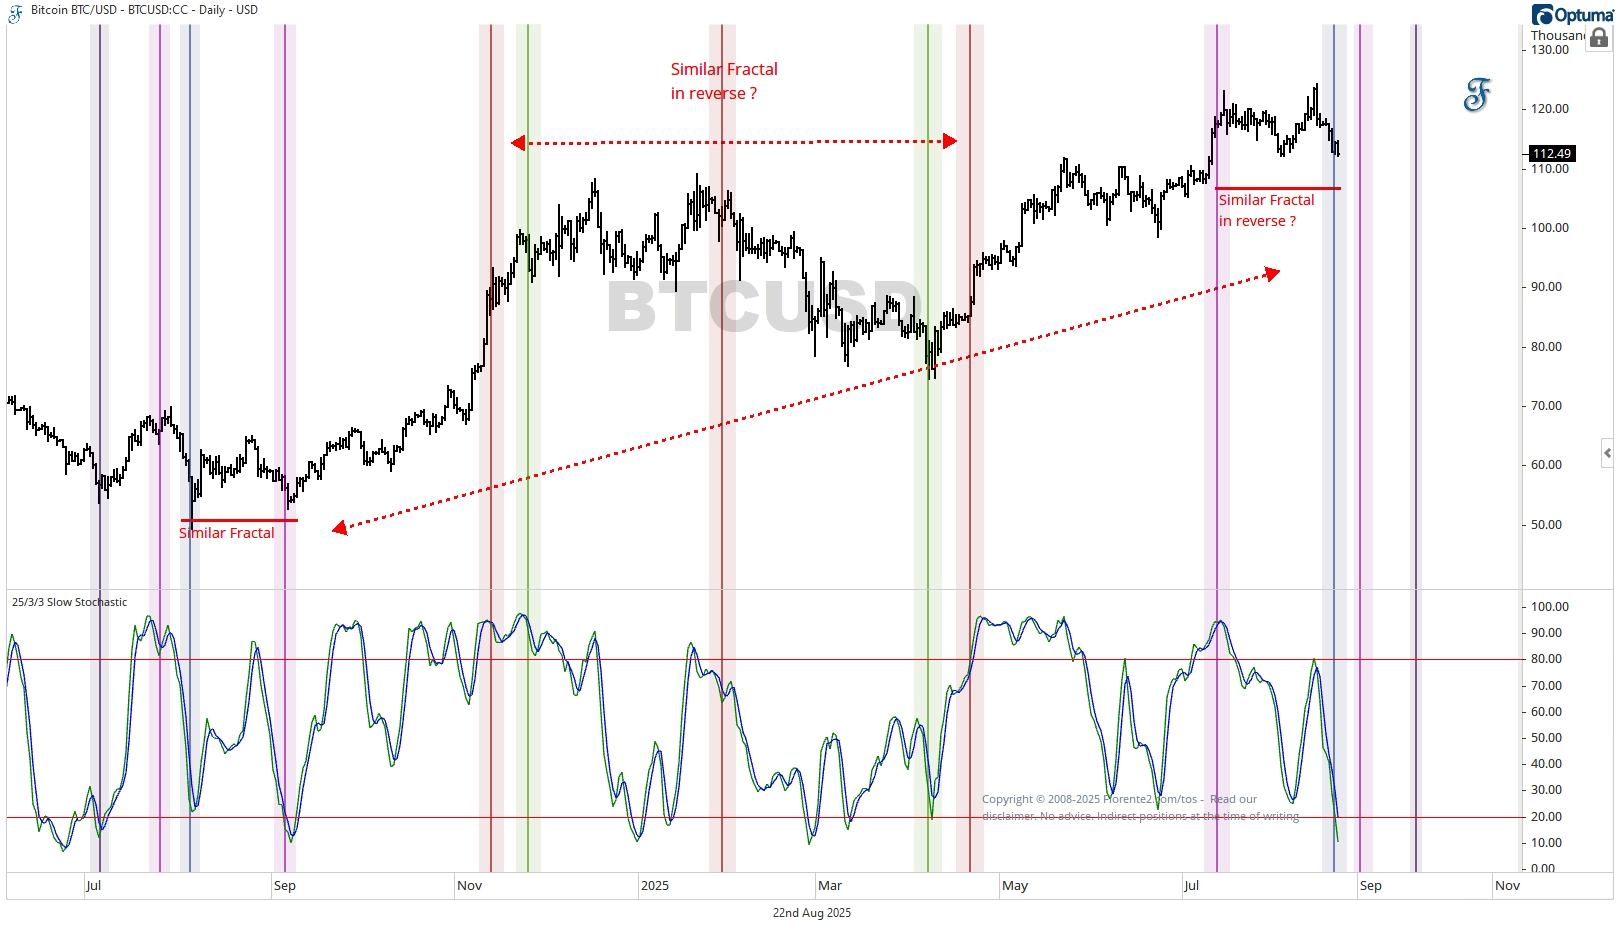
Follow the vertical lines that indicate key planetary angles from conjunction (at the same degree) to conjunction. Do you notice the repeating or reversing fractals? These planetary angles correspond with overbought or oversold zones, and that polarity can switch during this synodic cycle.
In this post, we will take a closer look at the planetary cycle that has been in alignment since last year, both in terms of price and time. Let’s explore what this means and how we can use a planetary cycle to understand potential changes in trends.