
Why Numbers Do Matter In The Stock Market
The number 666 revisited in the SPX and the DJIA

Introduction
W.D. Gann was a highly skilled mathematician who dedicated a significant portion of his stock market course to emphasizing the significance of numbers in analyzing the financial markets, as evident from the below excerpts.
‘‘…but anything that can be proved in any way or by any science is not correct unless it can be proved by numbers and by geometry.
It has been said. “Figures don't lie.” Men have been convinced that numbers tell the truth and that all problems can be solved by them. The chemist, engineer, astronomer would be lost without the science of mathematics.” W.D. Gann - Stock Market Course
W.D. Gann utilized planetary cycles in his financial market predictions but refrained from openly discussing them, citing that "the public is not ready for it.” Instead of using words, he utilized numbers and lines to communicate this information.
“There are three kinds of angles - the vertical, the horizontal, and the diagonal, which we use for measuring time and price movements. We use the square of odd and even numbers to get not only the proof of market movements but the cause.” W.D. Gann Stock Market Course
Here he hints at squaring price and time using odd and even numbers. In his work, he discussed specific numbers that frequently act as support and resistance points.
The Number 666
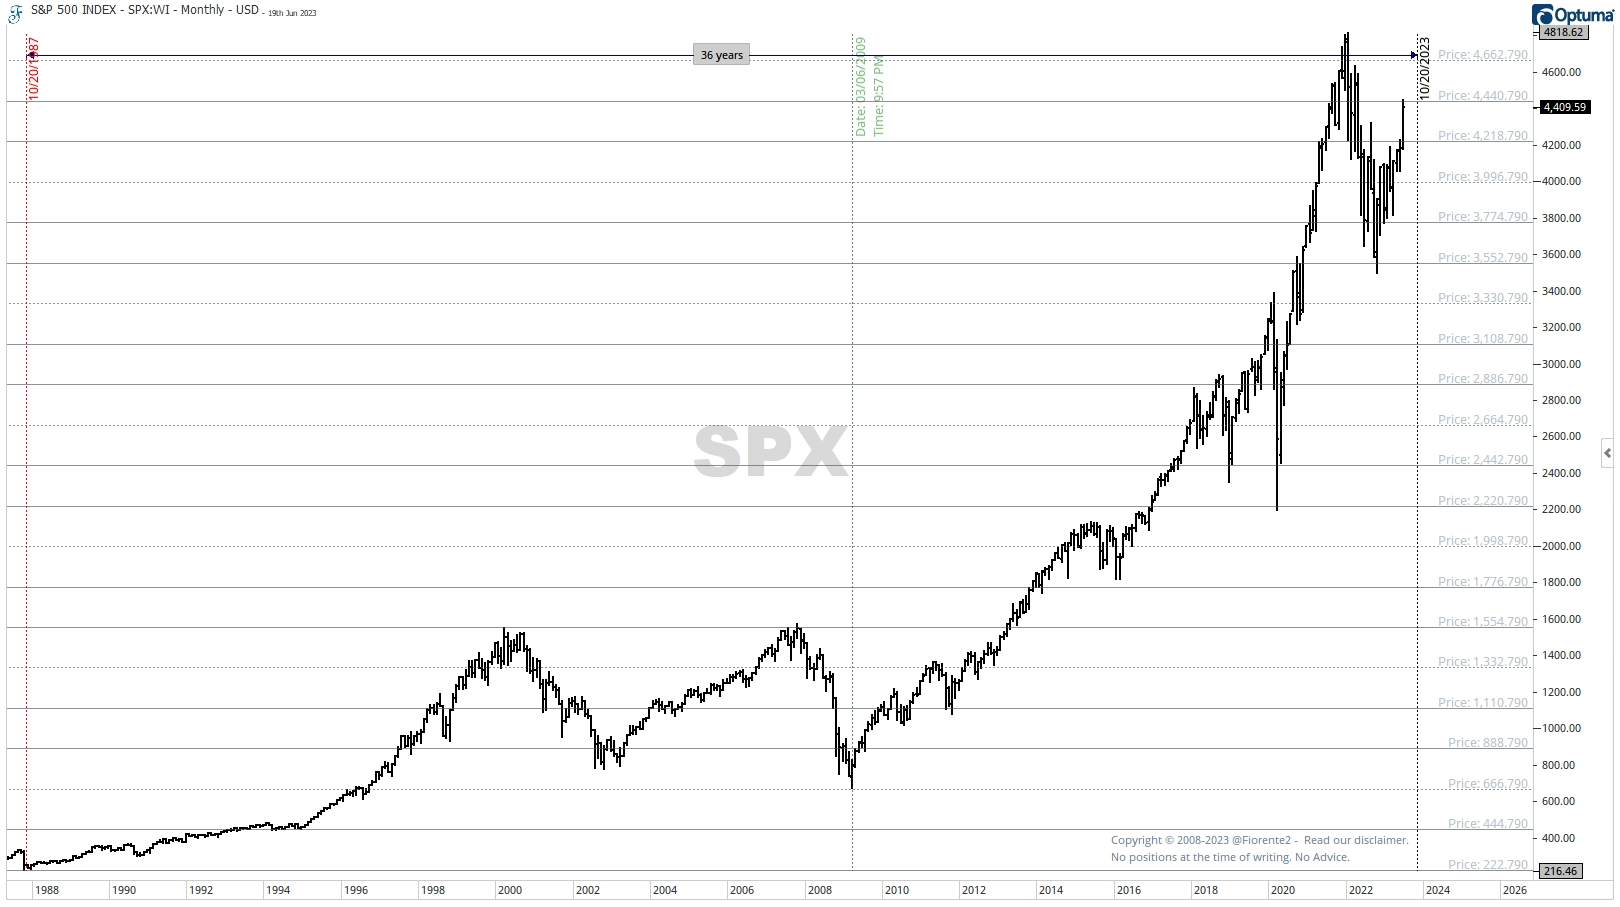
In recent years, I have observed a consistent occurrence of the number 666 in the stock market. An instance of this was during the March 2009 low in the SPX, which was recorded at $666. Interestingly, this number has remained significant, with its 1/3 harmonics forming crucial support and resistance levels on the monthly chart dating back to 1987, almost four decades ago.
Did you know that the numbers 666 and 36 have a connection? The sum of the first 36 natural numbers equals 666, and interestingly, 666 is a double triangular number since 36 can be expressed as the sum of two triangular numbers (15 and 21).
These two triangular numbers, when squared and added together, also equal 666 (15^2 + 21^2 = 225 + 441 = 666).
Another intriguing observation is that the DJIA chart shows a remarkable foldback when looking at the square of 6 (36) weeks. From February 2022 to the low in October 2023, the decline is just a 10-fold of $666.60.
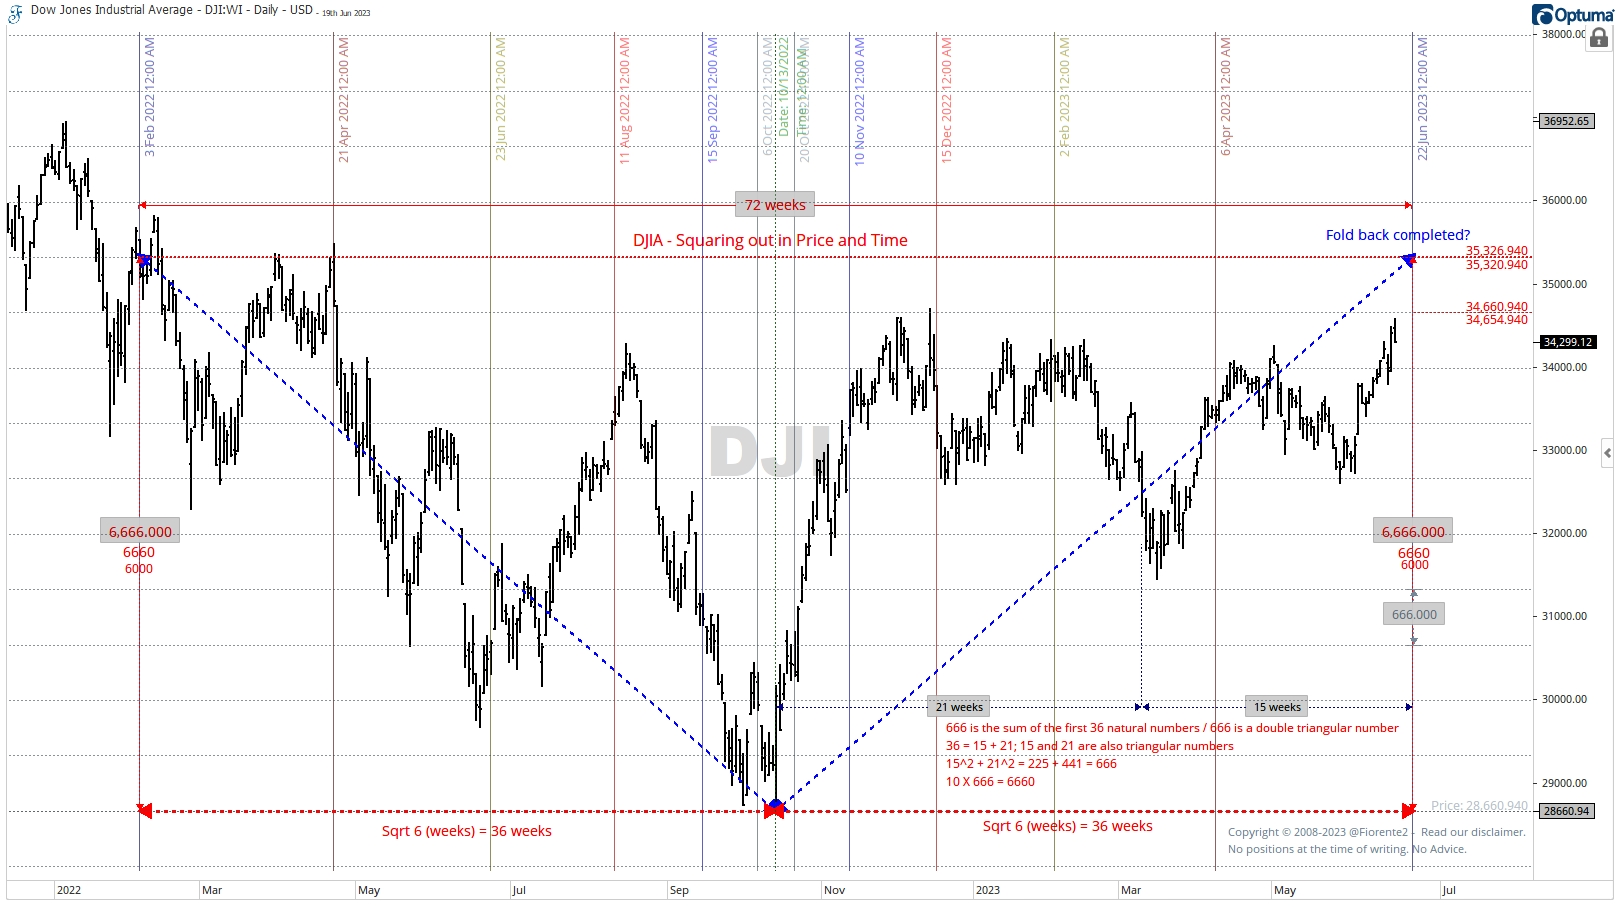
June 22nd, 2023, is the next square out in time and probably in price. This is also an important seasonal date. It seems that the DJIA is folding back in the same amount of price and time than the decline mentioned earlier. Time is more important than price, so be careful. As you can also see here, multiple levels of $666 from the lows of October have formed support or resistance in the past.
It is important to acknowledge the significance of numbers. Today's extra post for premium subscribers outlines additional reasons to expect a forthcoming peak in the US Indices. I have included the renowned George Lindsay's time interval, which aligns with the analysis from a different point of view. I will show you a use of the W.D. Gann's Square of Nine calculator to find probable support and resistance levels.
This analysis is intended for general informational & educational purposes only. Hypothetical or simulated performance based on past cycles has many limitations. Cycles can contract, extend, and invert. Anomalies can occur. Hence, past performance is no guarantee for the future. No advice. Please take a look at our full disclaimer.