
When will the music stop?- Part 2
#211 An harmonic analysis and update on DJIA, SPX and Nasdaq

Introduction
In early August, I shared a forecast based on a model I developed for forecasting future turning points on the US Indices using the NYSE natal chart. This NYSE Transit to Natal forecast is developed based on the planetary returns of cycles since the inception of the NYSE in 1792. As shown in the chart below, the forecast has been accurate so far.
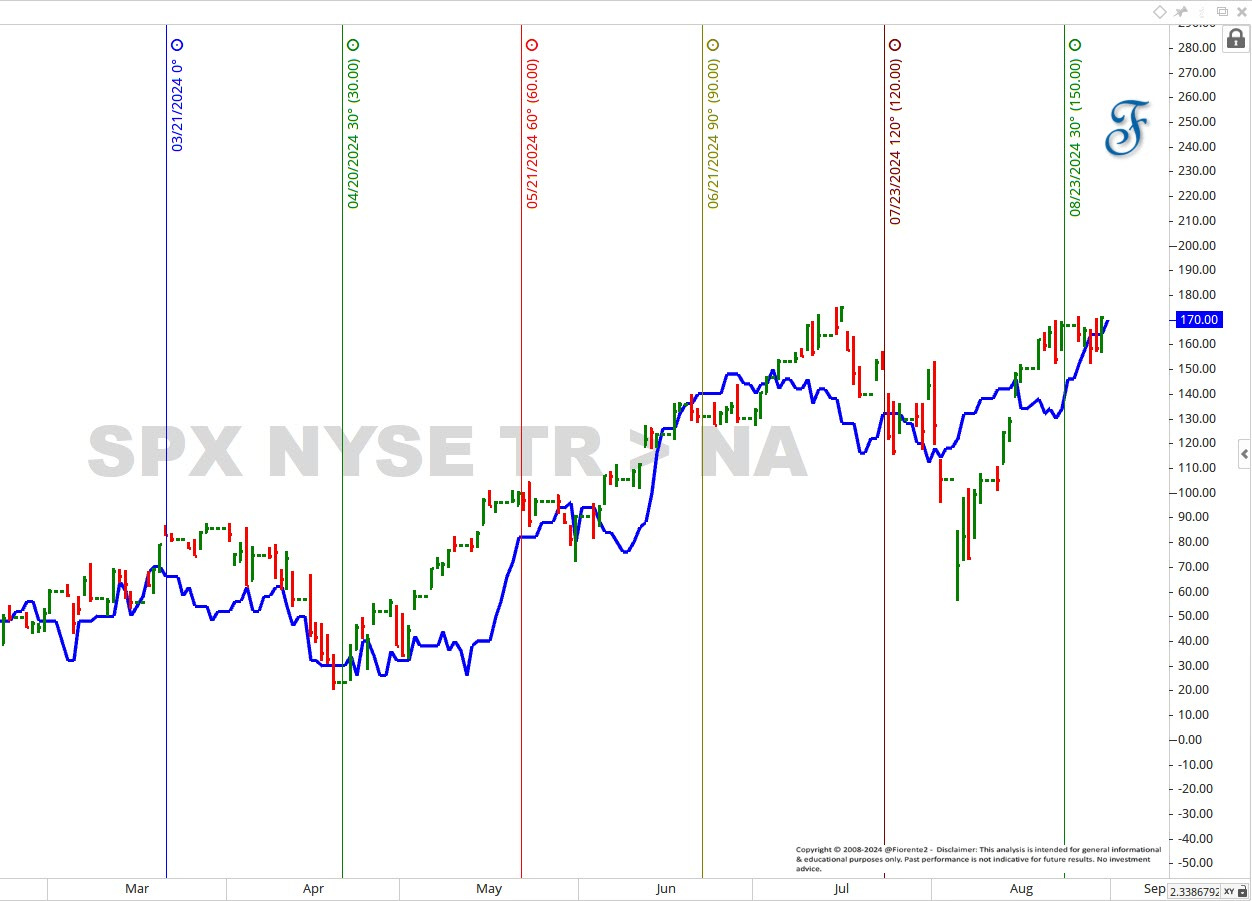
The blue forecast is solely based on time and does not forecast future price levels. Since price and time can be interchanged, one can use a harmonic of the price level to forecast future turning points.
W.D. Gann used to divide the range between major highs and lows into 8 equal steps, known as the Eights tool, to identify the future support and resistance level. As the range is not yet known, one could use 8 equal parts of any price or a harmonic of this pattern to project forward in price and determine the support and resistance levels.
Similarly, for the element of time, one could apply the same method, as W.D. Gann also mentioned in his Stock Market Course: "The resistance levels given (below) are based upon natural law and can be applied to the measurement of both time and space."
In my recent post on “When will the music stop?” I analyzed the NYSE Advance-Decline Volume ratio and argued that based on a harmonic analysis of this indicator using 1/8 of fractal or 45-degree increments, I did not see momentum to the downside in the stock market yet.
This week, I examined the US indices DJIA, SPX, NDX, and Nasdaq Composite to determine if there is a correlation in price and time with the NYSE Transit to Natal Forecast. I have updated this post with the NYSE Transit to Natal forecast up to November. Additionally, I have included breakout/reversal levels for world indices and updated my weekly Gann Master cycle charts for the SPX and DJIA.