

Introduction
Last week I wrote about “Cycles synchronize at the bottom of the stock market, and a change in trend will not occur until these have bottomed. So, always wait for the confirmation that a bottom has set in. For example a higher high and higher low in the stock/index or indicator may help to identify this.”
This does not always have to happen. There are enough examples in the past for a sharp V-bottom instead of a W-bottom. Based on my NYSE Transit To Natal Indicator, I do expect to see some downward pressure coming up shortly, but I do not expect that to be major.
Looking at the NYSE breath, using the Advance-Decline-Volume Indicator, this stock market is clearly making higher highs and higher lows, and despite the doom-and-gloom analysts on Twitter, I do not see this changing soon.
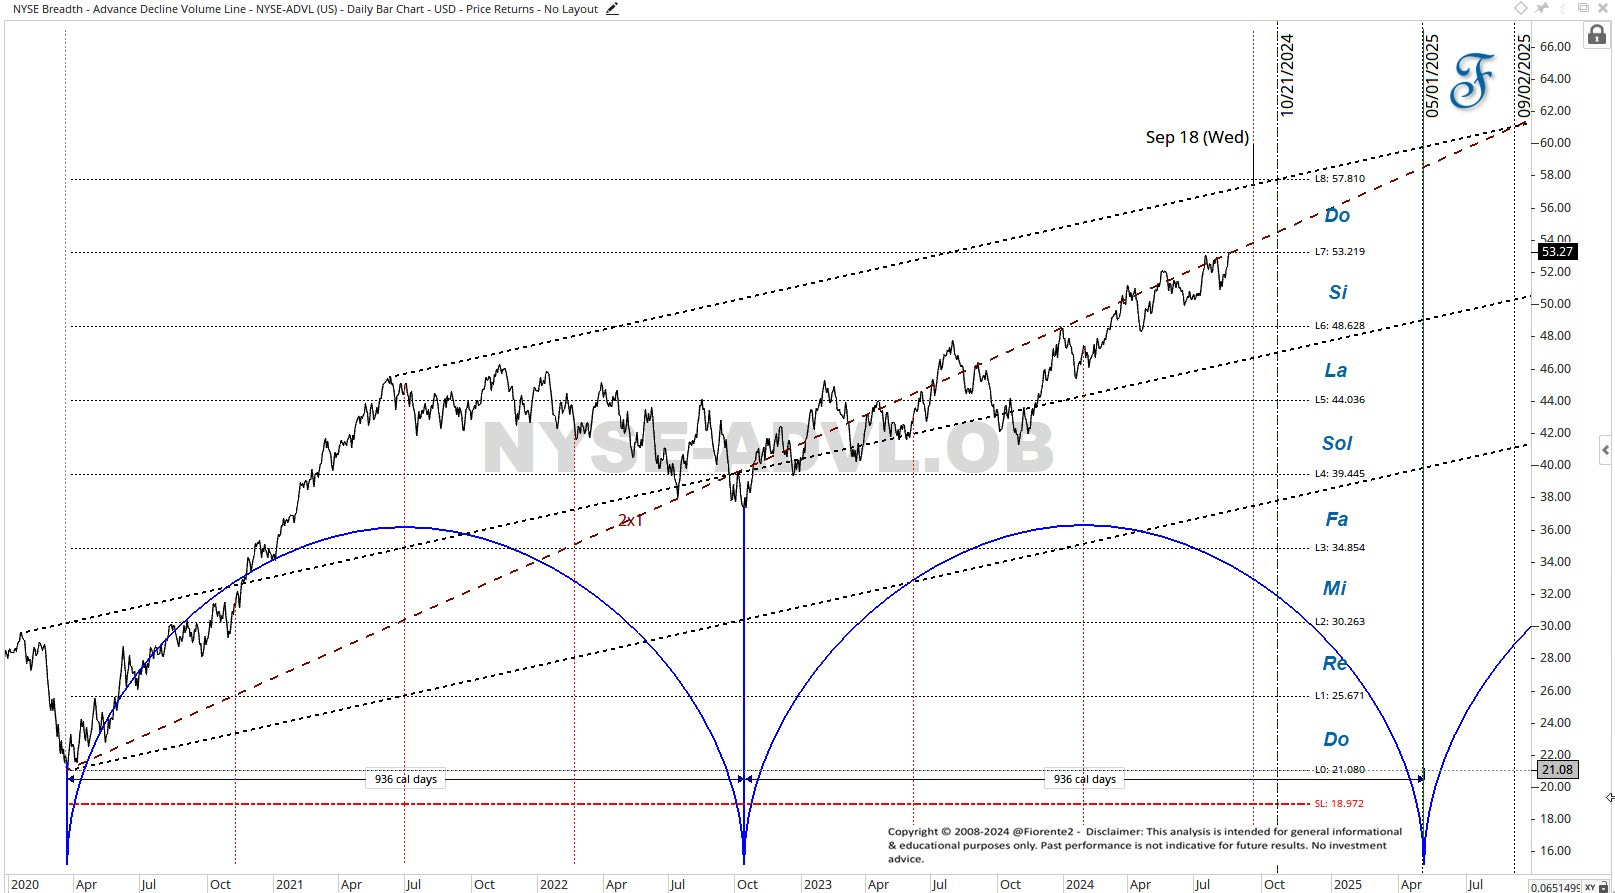
The earliest major resistance is around mid-September 2024, but that would be early in a cycle. By squaring the low of this indicator, every $4 advance shows support and resistance.
W.D. Gann used to divide the range between major highs and lows into 8 equal steps, often known as the Eights tool. You can also do this by squaring the low or high in a similar way, and you often see that the square root of the high or low is a good price increment where the next higher/lower support or resistance area can be expected. Currently, we are at such a price level, and I expect some resistance here, which is aligned with my NYSE Transit to Natal Indicator. In music, there are 8 notes per octave. Hence, a division of eight equal parts makes sense.
If we assume October 2022 to be some sort of midpoint, the next cycle high is expected no earlier than mid-2025. Based on the 1x1 and 2x1 Gann Timing lines, the high could be printed at a later date, early September 2025.
So far, I do not see evidence that this stock market is going to collapse, as some doom-and-gloom pundits are screaming on Twitter. I can be wrong, of course, but have a look at NVIDIA. Does this pattern of moving averages plotted on the chart look like a vulnerable stock? It rather looks like a pullback.
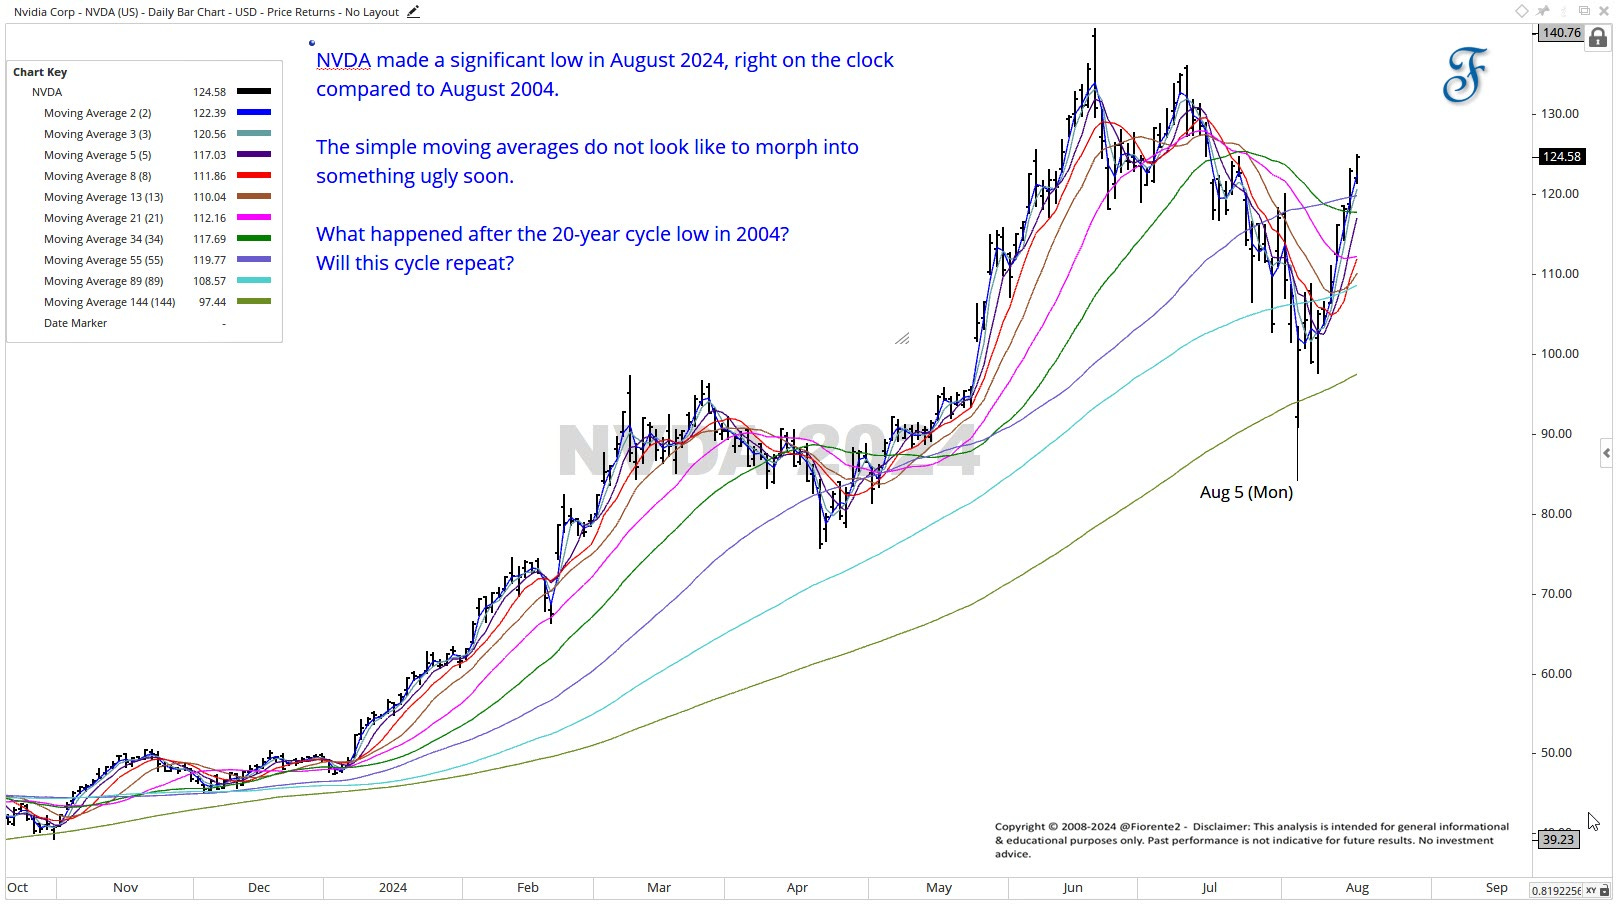
What happened here? The 20-year cycle made an exact low in time compared to the low in August 2004. The pullback landed at the 144 moving average (note this is at the square of twelve) and is long-term support. NVDA is currently trading above all moving averages plotted on the chart. It does not mean we may not see a pullback anymore.
If this 20-year cycle continues, NVDA’s future is still bright. With the AI innovation theme and the need to increase speed and performance in chip technology, I can not imagine this stock continuing to decline. But anomalies can occur… Have a look at what happened 20 years ago…