
What time did you wake up this morning?
#265 An update on the main trends in the US Indices.

Introduction
Cycles are a fundamental part of our daily lives. We have a routine that includes waking up, probably hitting the gym early, having breakfast, working, taking lunch breaks, and unwinding in the evening before bed. Do these activities occur at the same time every day? Probably not. Each day can differ, much like other natural cycles that vary from their average.

Cycles rarely occur at the same precise moment each time. Long-term cycles can diverge by as much as eight months from what is typical, making it impossible to nail down the exact timing of when a long-term cycle will manifest. Note: At the trough of October 2022, the 60-year cycle accuracy was within 14 days.
So, why do we track cycles? It helps us gauge our position within the business cycle. Recognizing potential peaks and valleys ahead can give us an edge over other investors who may be thrown off by daily and often conflicting news.
Cycle analysis allows us to forecast potential peaks or troughs, but it’s important to remember that it introduces a degree of uncertainty. Cycle analysis is not a prediction. Cycles can contract, extend, or even invert. Often, longer-term cycles can sustain the trend and even mitigate the impact of shorter-term cycles.
Therefore, it’s essential to avoid trading solely based on cycle forecasts; they offer valuable insights but are not guarantees. Always consider the direction of multiple cycles. Cycle analysis will need additional confirmation from other technical or fundamental analyses.
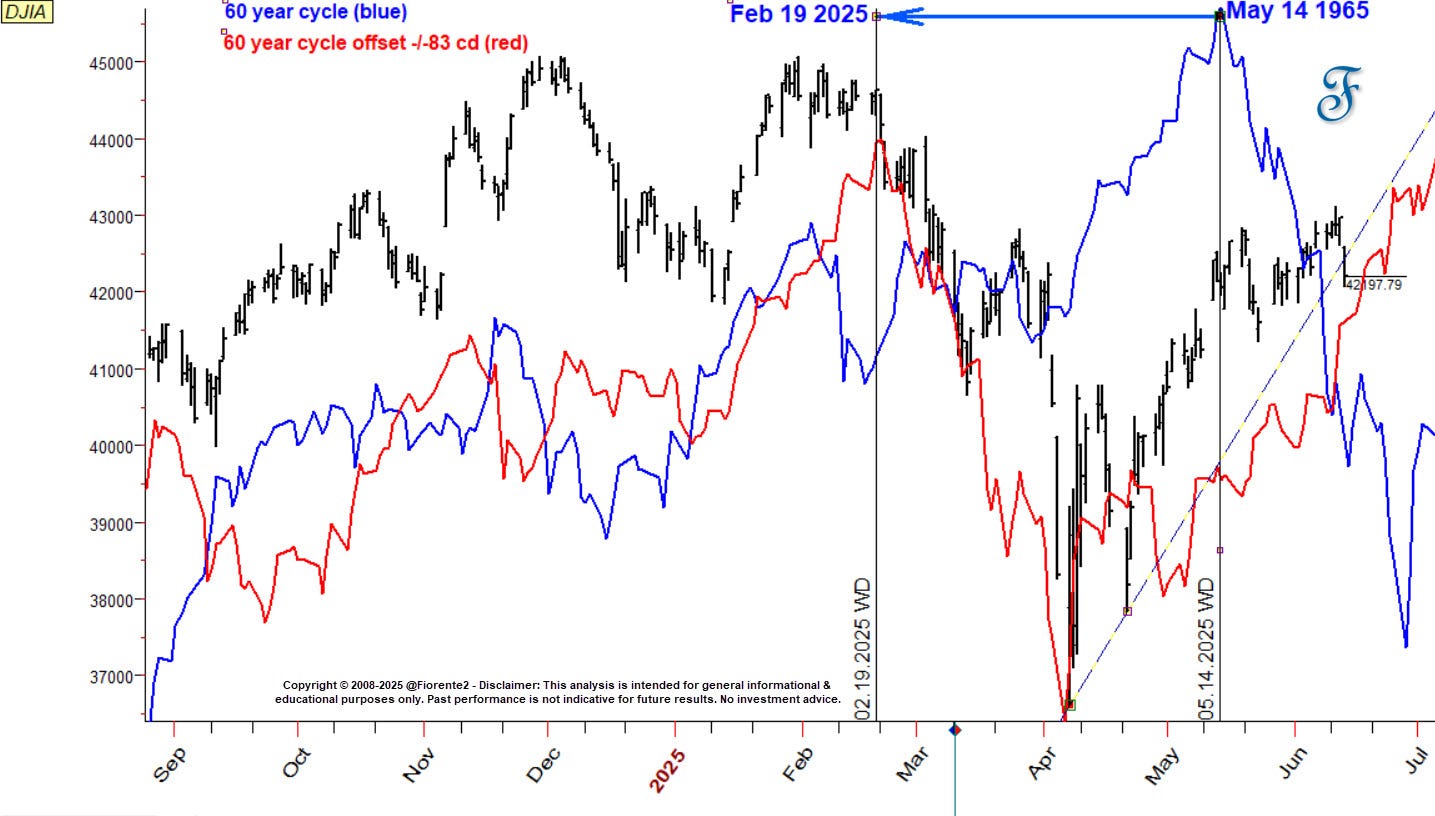
This year, the 60-year cycle remains active. The nominal 60-year cycle, closely linked to three times the nominal 20-year Jupiter-Saturn cycle, is actually closer to 59.6 years.
The anticipated peak for this cycle, originally expected on May 14 (parallel to 1965), occurred earlier on February 19, 83 days ahead of schedule. Similar to 1965, this was influenced by rising inflation fears related to increased U.S. tariffs. Perhaps investor fears follow a similar pattern.
Interestingly, even the recent deployment of the National Guard in California aligns with a 60-year cycle. Similar to the 1965 protests, the current demonstrations are a renewed concern about the civil rights of people.
For trading strategies, it may be better to focus on medium-term to shorter cycles within the larger cycles. The Hurst methodology provides a valuable framework for understanding the varying dominant cycle lengths, and, where possible, cycles may synchronize at a trough or crest.
I updated last week’s dominant cycle analysis on the US indices, and in today’s update, I will explain how Hurst confirmed when cycle troughs have likely formed.