What is happening in the Markets - Approaching seasonal dates
#164 Reviewing the US Indices and Nikkei 225, Top-10 US Stocks, High Yield Bond ETF and BTC USD
Introduction
A reader commented on a W.D. Gann quote I mentioned in a substack note about seasonality.
“Stocks make important changes in trend every 30,60,120,150,210,240,300,330,360 days or degrees from any important top or bottom”. W.D. Gann Stock Market Course
The reader expressed doubts about the validity of seasonality and commented, "If you do this, you will find no pattern." I missed his argument that there is no pattern. I reviewed tens of thousands of charts during my life, and my experience is different.
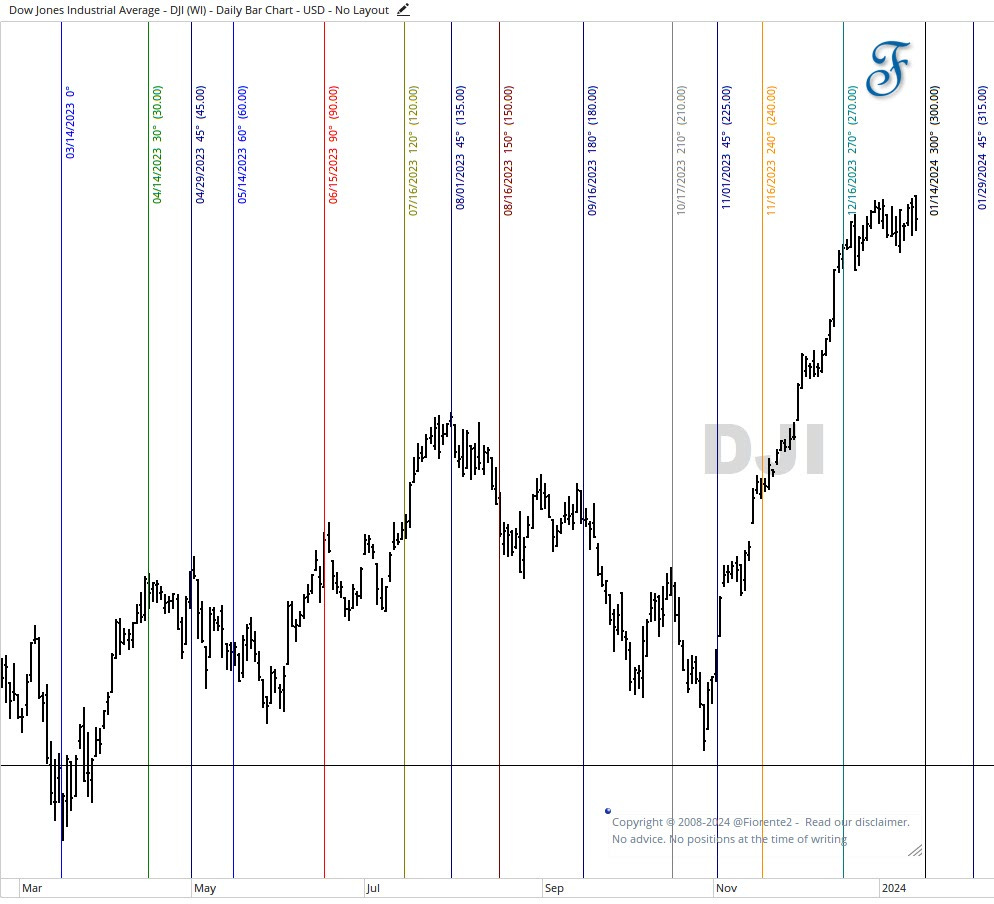
To test his claim: ‘you will find no pattern’, we will observe the March 2023 low of the DJIA and track its progress every 30 solar degrees forward. I also included half of the 30 solar degrees. Please refer to the chart below and draw your own conclusions:
I leave it to the reader to conclude what happens at every degree Gann mentioned. I can see the market reversals following the amount of solar degrees from the March 2023 low. This was an important point. Is it always a reversal? No, it can also reinforce the current trend. The important point here is “to find the right beginning.” That is usually an important top or bottom or a seasonal date like December 21st or March 21st of each year.
Based on this chart, I would not be surprised if the DJIA continues its uptrend until 180 degrees from August 2023 Top to January 29th, 2024.
P.S.: Another use of this technique is using synodic cycles, like Mars-Uranus and 15 or 30-degree moves from an important top or bottom. Usually, the panic and volatility around these tops and bottoms can be seen every 15,30,60, or 90 degrees, and this might go on for many years. In this post, I will show the premium subscribers how this Mars-Uranus cycle fits with BTCUSD reversals.
Looking back
W.D. Gann was known to publish his annual market forecasts in November of each year. Sometimes, he would wait till January to make sure that the markets were following the expected forecasts.
Similarly, I made my 2024 forecasts in late November and December 2023. Though I am fairly confident about the forecasts, I cannot guarantee them as cycles can contract, extend, and invert, and anomalies can occur. However, I did a quick review of how they are doing against the real markets.
My forecasts cover major world indices, commodities, cryptocurrencies, US Treasuries, and the USD Dollar Index. They include the annual cycle or seasonal cycles next to the Mass Pressure Indicator (MPI) that I developed based on the significant aspects (hard/soft angles) of planetary pairs. Note that this MPI indicator does not forecast price, but potential market turns. As W.D. Gann taught: “Time is more important than Price”.
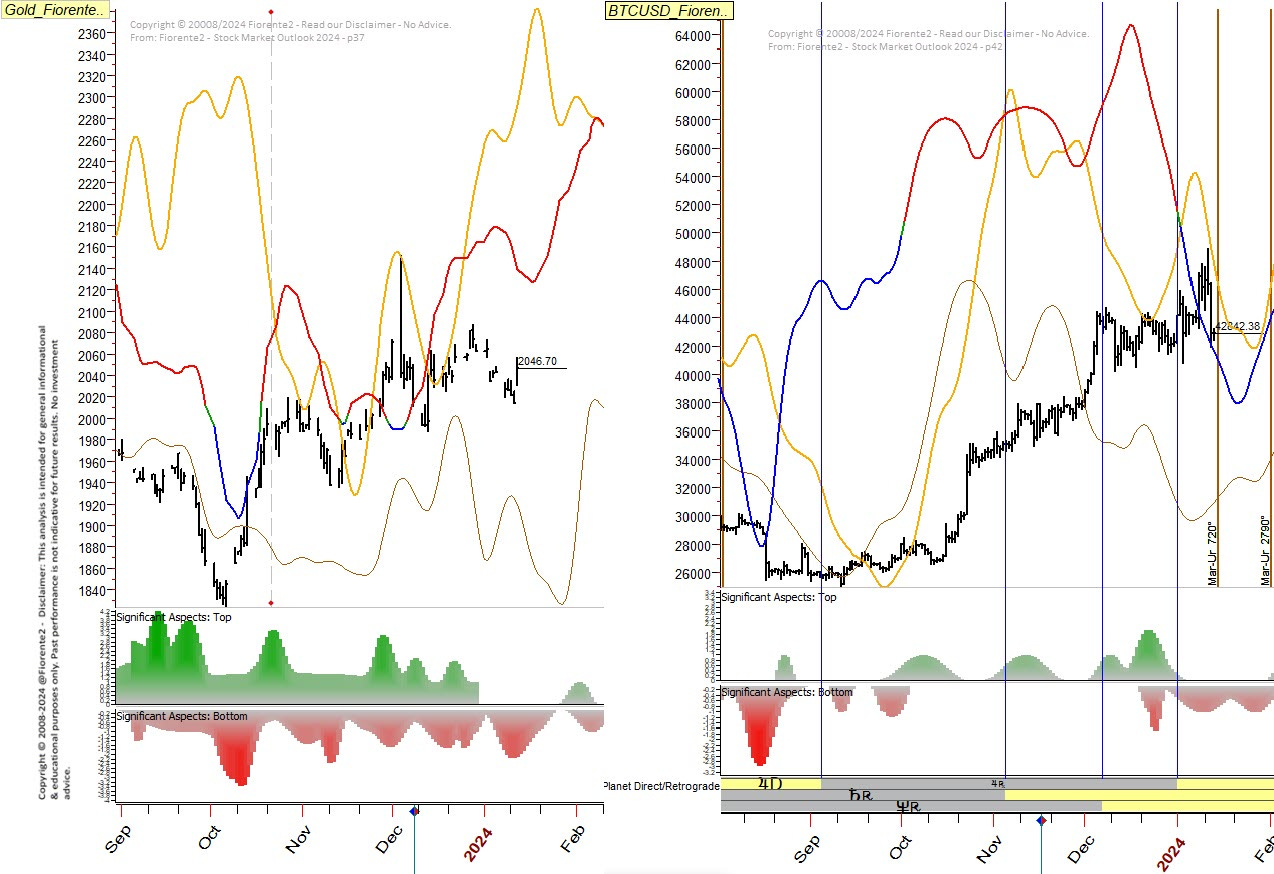
So far, the forecasts resemble what is happening in the markets. In the below chart you can see how Gold and BTCUSD have been following the cycles.
The two charts display the positive (green) and negative (red) aspects of the market that caused tops or bottoms. These aspects have occurred at least 10 times and have a minimum probability of 68.2%. It is important to note that the forecasts are hypothetical and past performance is not a guarantee for future results. However, this analysis can provide additional information to aid in your due diligence.
In this weekly update for our premium subscribers, we will be covering the US Indices, Top-10 US Stocks, Nikkei 225 Index, JNK- High Yield Bond ETF, and BTCUSD with updated charts.
Don’t miss out on the latest Fiorente2 Stock Market Outlook 2024, a 55-page digital eBook publication that provides a comprehensive analysis of World Indices, Commodities, Gold, Silver, Oil, Wheat, Treasury Notes, and Crypto Currencies. The publication features fully back-tested Mass Pressure Index charts for each equity year ahead and is available for download on my Gumroad website.
P.S.: You can still pre-order at $45 until January 21st, 2024. After that, the price will be $60. Additionally, premium subscribers on Substack can enjoy a special discount (see the discount button after the paywall)
This analysis is intended for general informational & educational purposes only. Hypothetical or simulated performance based on past cycles has many limitations. Cycles can contract, extend, and invert. Anomalies can occur. Hence, past performance is no guarantee for the future. No advice. Please take a look at our full disclaimer.


