Introduction
In the last few weeks, I have posted an analysis for the premium subscribers on the US Indices, illustrating a potential sideways W-top pattern unfolding over the next few weeks. It is an important pattern to watch, but I may be early in my assessment of a potential W-pattern unfolding in the US Indices.
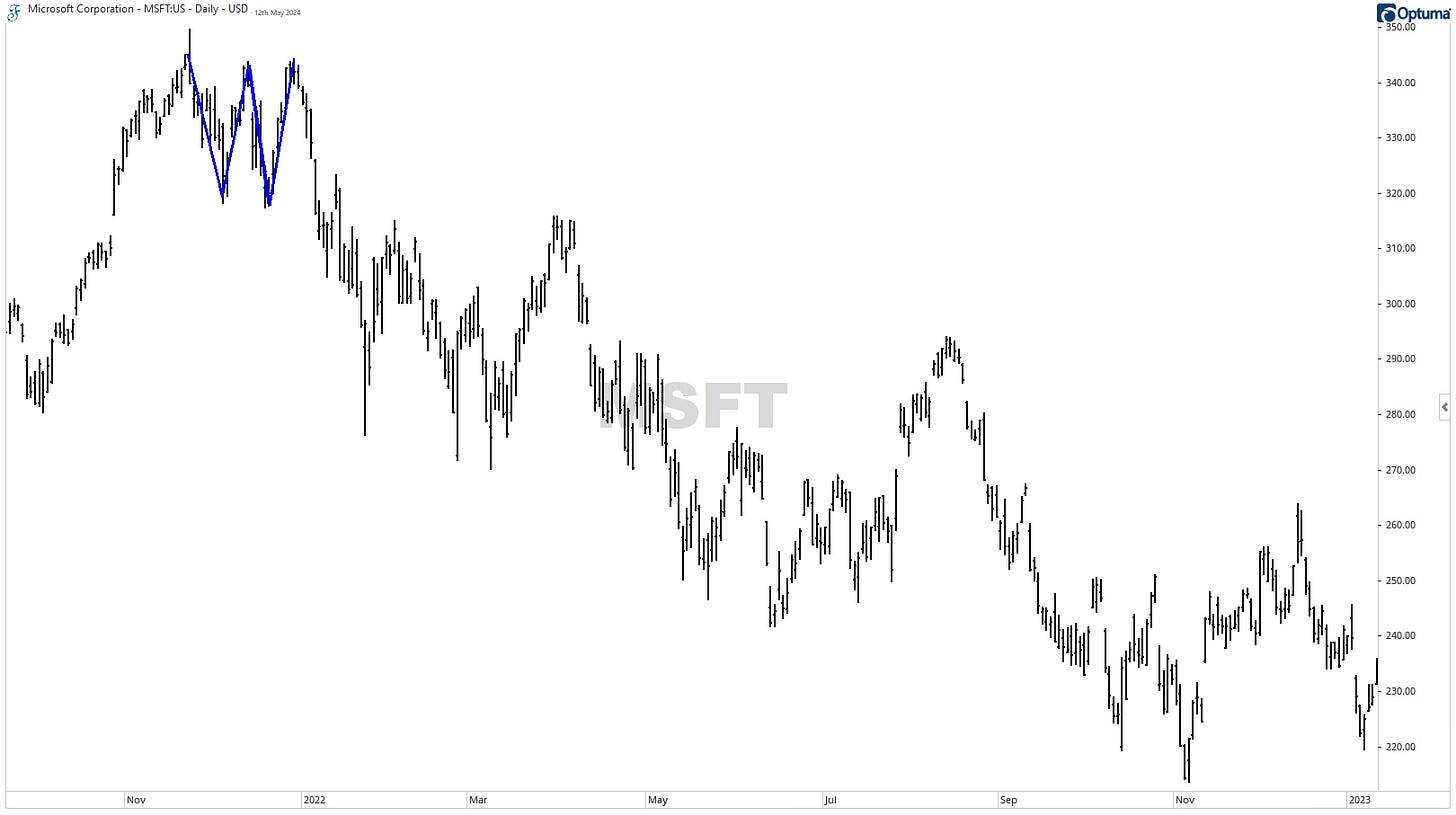
A W-top pattern signals a potential reversal in a stock's price trend from bullish to bearish. This pattern is formed when the stock's price rises to a peak, then drops, rises again but not as high as the first peak, and then drops again. Traders refer to this pattern as a "W" because of its shape on the chart. It can take several weeks or months for a W-pattern to complete. Of course, at the bottom of a trend, the W-pattern is often a bullish scenario.
Below is an example from MSFT at the end of 2021, forming a W-top pattern. You can see what happened after the pattern was complete.
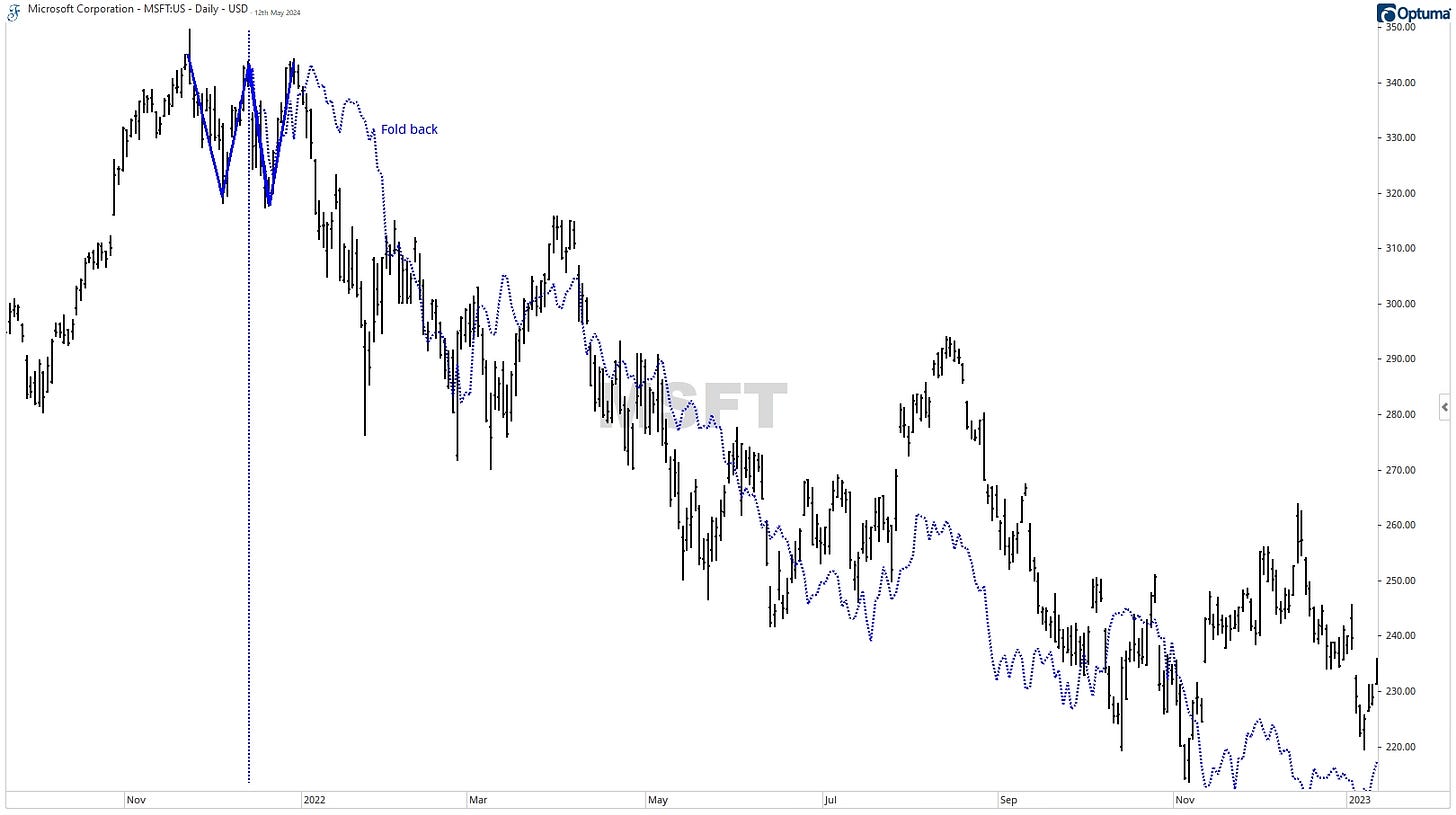
You can often draw a mirror-image foldback from the midpoint of the W for the future price direction. In this example of MSFT, it went all the way back in an almost similar price-time manner, as seen in the uptrend.
So, in my analysis, I like to watch for these patterns that can signal the start of a potential foldback scenario.
Using foldback scenarios, it is good to note that they will eventually cease to function and that time is more important than price.
The premium subscribers can read on from here.


