
Using Gann Analysis to Forecast Future Patterns
A summary on using patterns, foldbacks and angles.

Introduction
SPX $DJIA #Gann
This post is an update to the recently published foldback, which is still on track. Mirror image Foldbacks are good to follow but, at some point, may cease to function. Angles can greatly help detect and forecast the future of these patterns. I published this earlier in a Twitter thread 🧵 today and on April 18th/20th.
I enhanced today’s Twitter thread with some additional notes.
The chart below is an update on the April 18th/20th charts ( see link above) posted on Twitter. So far, so good. If the foldback continues, the path is clear.
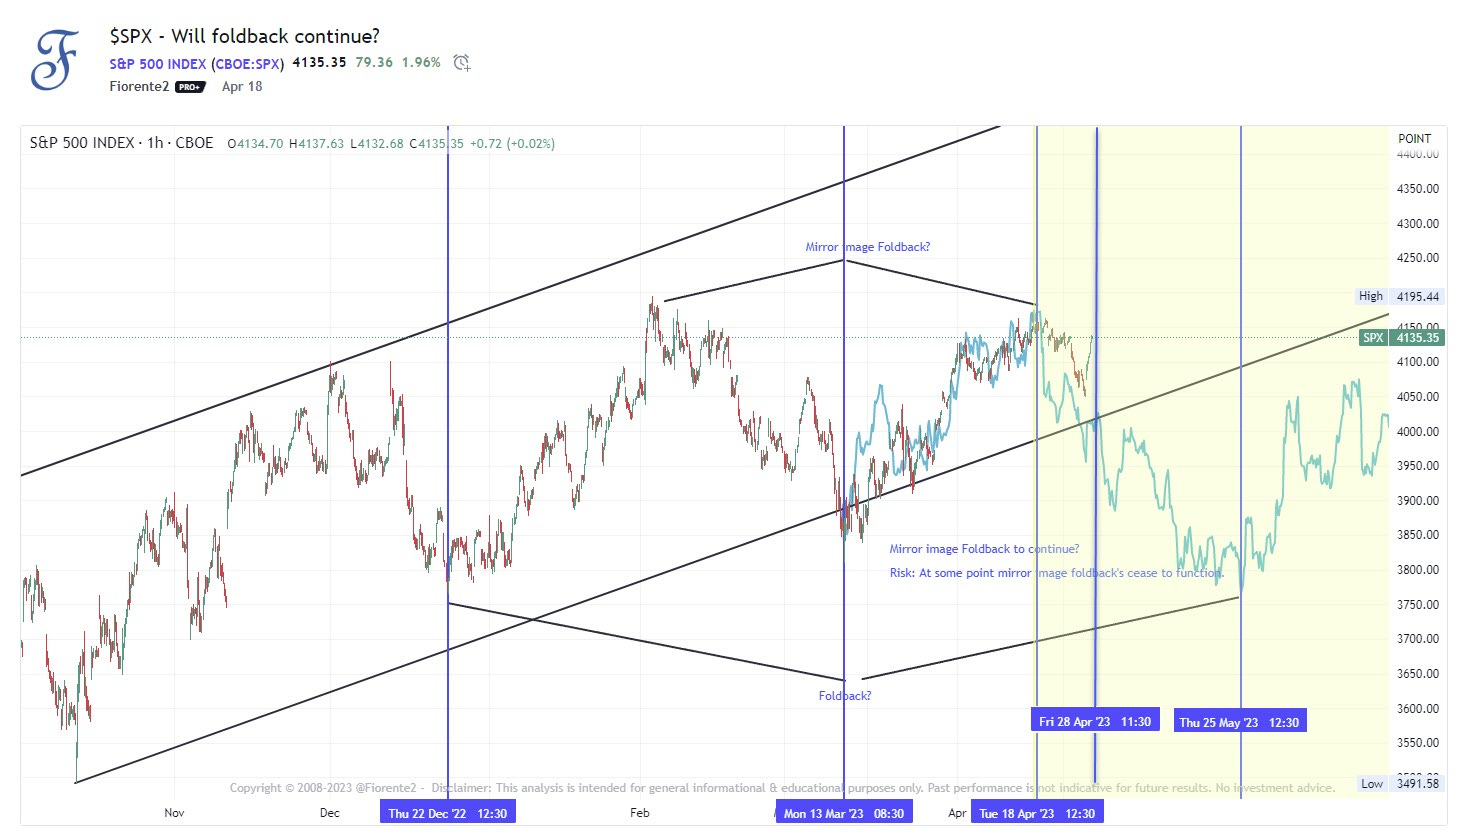
The path may be similar but slightly different. Time is more important than price. If the future trend deviates too much from the past, the foldback may not be relevant anymore. Other larger cycles may still be in play. So, always watch the chart in front of you.
Form Reading
W.D. Gann used patterns or form reading: “Eight-five percent of what any of us learn is from what we see. "One picture is worth a thousand words.”
"That is why FORM READING or the reading of various formations at different periods of time is so valuable."
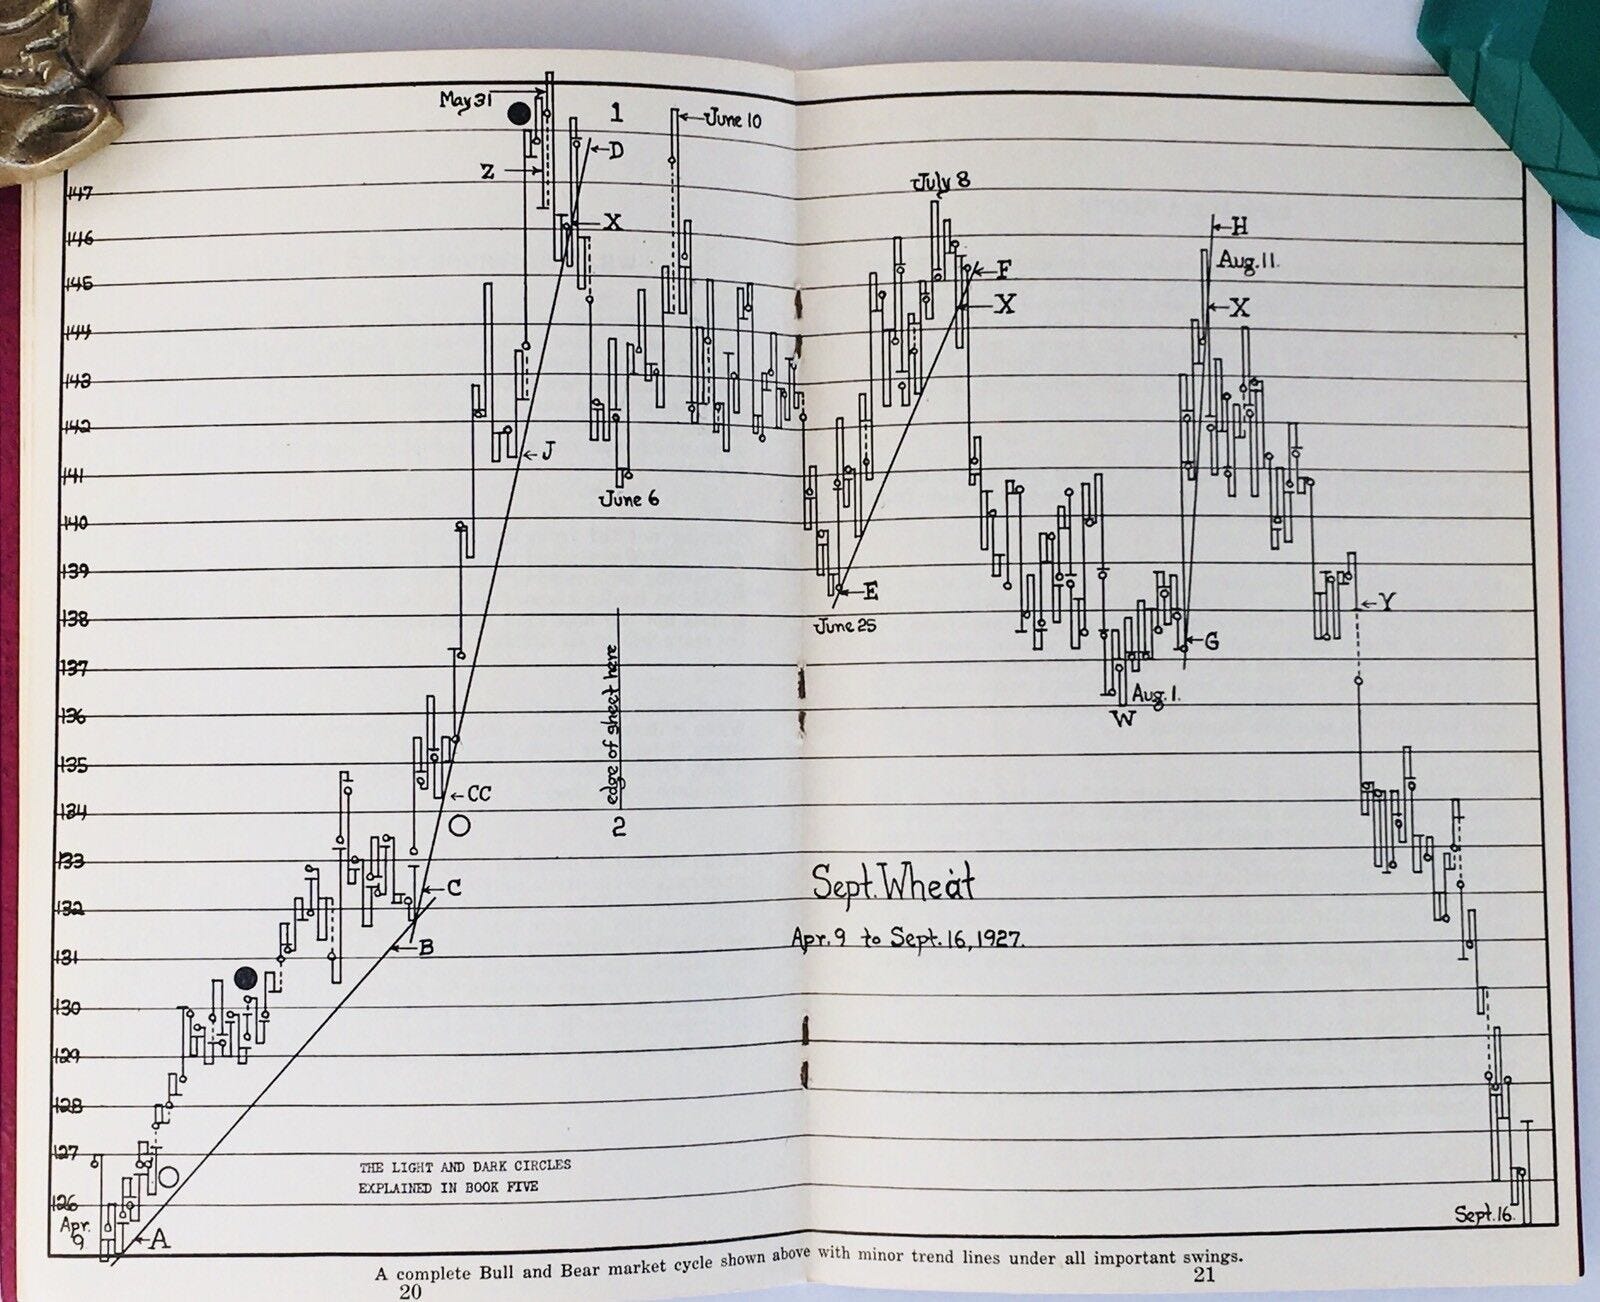
W.D. Gann was not the only one who applied the theory of Gann, as you can see in the above picture.
Geometric nature of patterns
Patterns in stock and commodity charts showcase their inherent geometric nature. As a result, these charts abide by geometric laws. Gann discovered this principle and utilized it to create a forecasting method that involves squaring both price and time.

As W.D. Gann mentioned in his Stock Market Course:
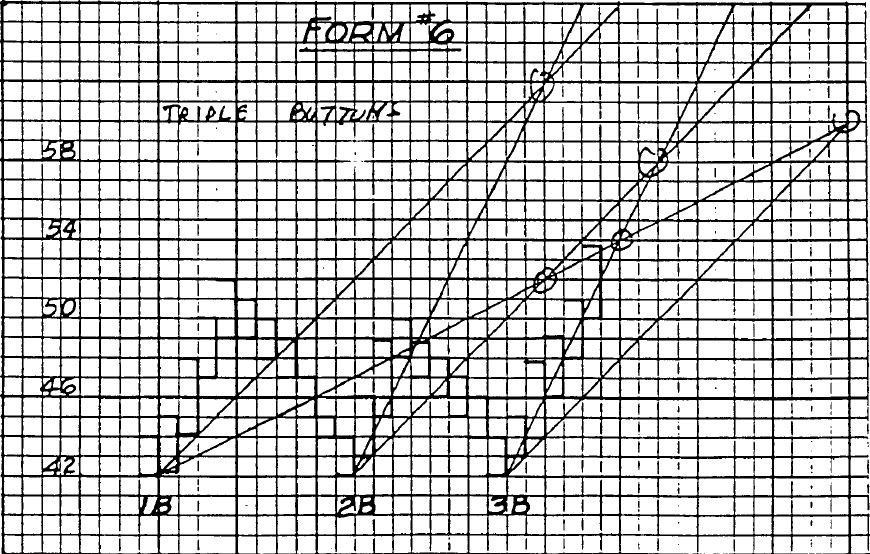
"The future is but a repetition of the past." "Therefore, when you see the same picture or formation in the market the second and third time, you know what it means and can determine the trend." Such an example is a triple bottom.
Using angles
Gann suggests drawing a 1x1 and 2x1 angle from significant tops or bottoms. This practice can reveal potential turning points, making time more important than price levels. So, the height in price may not be reached. If it reaches the circled points in price and time, a square out and change in trend is more likely to occur.
Using this approach, observe the angles/trendlines from the October '22 "W" low in the below chart. I also drew an alternative foldback from the middle section of the “W” at the October ‘22 low to look for a possible fit with the angles.
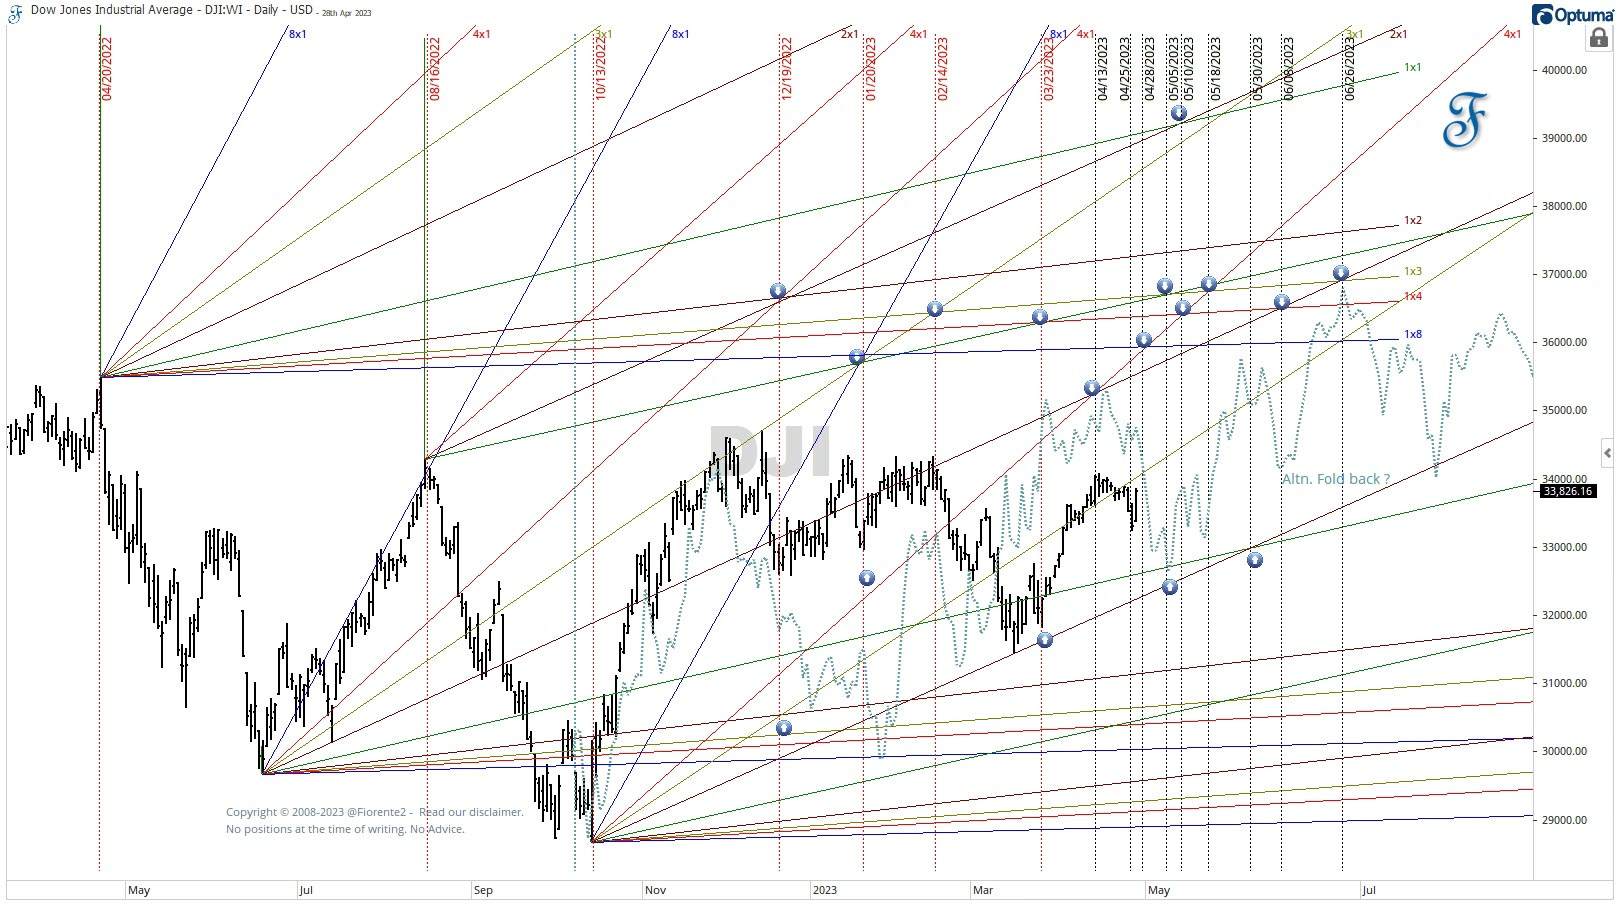
The price/time ratio was set to $10/calendar day. The 1x1, 2x1, etc. angles all vibrate on the ratio.
Often when the angles cross each other, this may hint at a minor or major cycle to culminate. This may coincide with minor or major planetary aspects, giving additional information. Look at the crossings of past angles and the changes in trend. At the crossings, a square out in price and time may occur.
If the trendline or angle is broken from below to above or vice versa, the next angle/trendline may be in play. Often these lines are trendlines of planetary moves.
I drew in some arrows to pinpoint possible future changes in trend. Although the foldback in the first chart may continue, review the foldback from the October 22 “W” closely, as some major cycles converged at that important low in time. So, that foldback may be more important.
Conclusion
Angles and patterns may hint at future cycles that can change trends later. They are a valuable source of additional information hidden in the chart patterns. Cycles can contract, extend, or invert. When multiple cycles converge, the trend will change.
Time is more important than price. If the future trend deviates too much from the past, the foldback pattern may not be relevant anymore. Other larger cycles may still be in play. So, always watch the chart in front of you.
In this week’s Gann Master Cycle update, I will publish similar charts for the other two US Indices for the premium subscribers.
This analysis is intended for general informational & educational purposes only. Hypothetical or simulated performance based on past cycles has many limitations. Cycles can contract, extend, and invert. Anomalies can occur. Hence, past performance is no guarantee for the future. No advice. Please take a look at our full disclaimer.
Disclosure: No positions at the time of writing in the US Indices.