
US Stock Market Setting Olympic Records
#195 An update on the US Indices: DJIA, S&P500, Nasdaq & NIKE, Inc

Introduction
The US indices are still following the Gann Master Cycle. As long as I follow this 60-year cycle, I've never found a better long-term cycle to follow the overall trend. Now and then it may invert, but it always seems to come back to its original trend. Like in 1964, the US indices are setting Olympic records in 2024. Like in 1964, technology is the foremost driver for this trend. We have come a long way in 60 years. From the early huge mainframes, today's technology almost fits on a very small chip. Now, we are advancing in technology with Artificial Intelligence, and I do not see an end to the technology advance yet.
Speaking of Olympic records, in the year of the Summer Olympic Games, you may want to have a look at NIKE, Inc. (NKE). There is an interesting article in Barron’s about its fundamentals, which caused the recent declines. Perhaps in this Olympic year, we may see some further recovery into the end of the year.
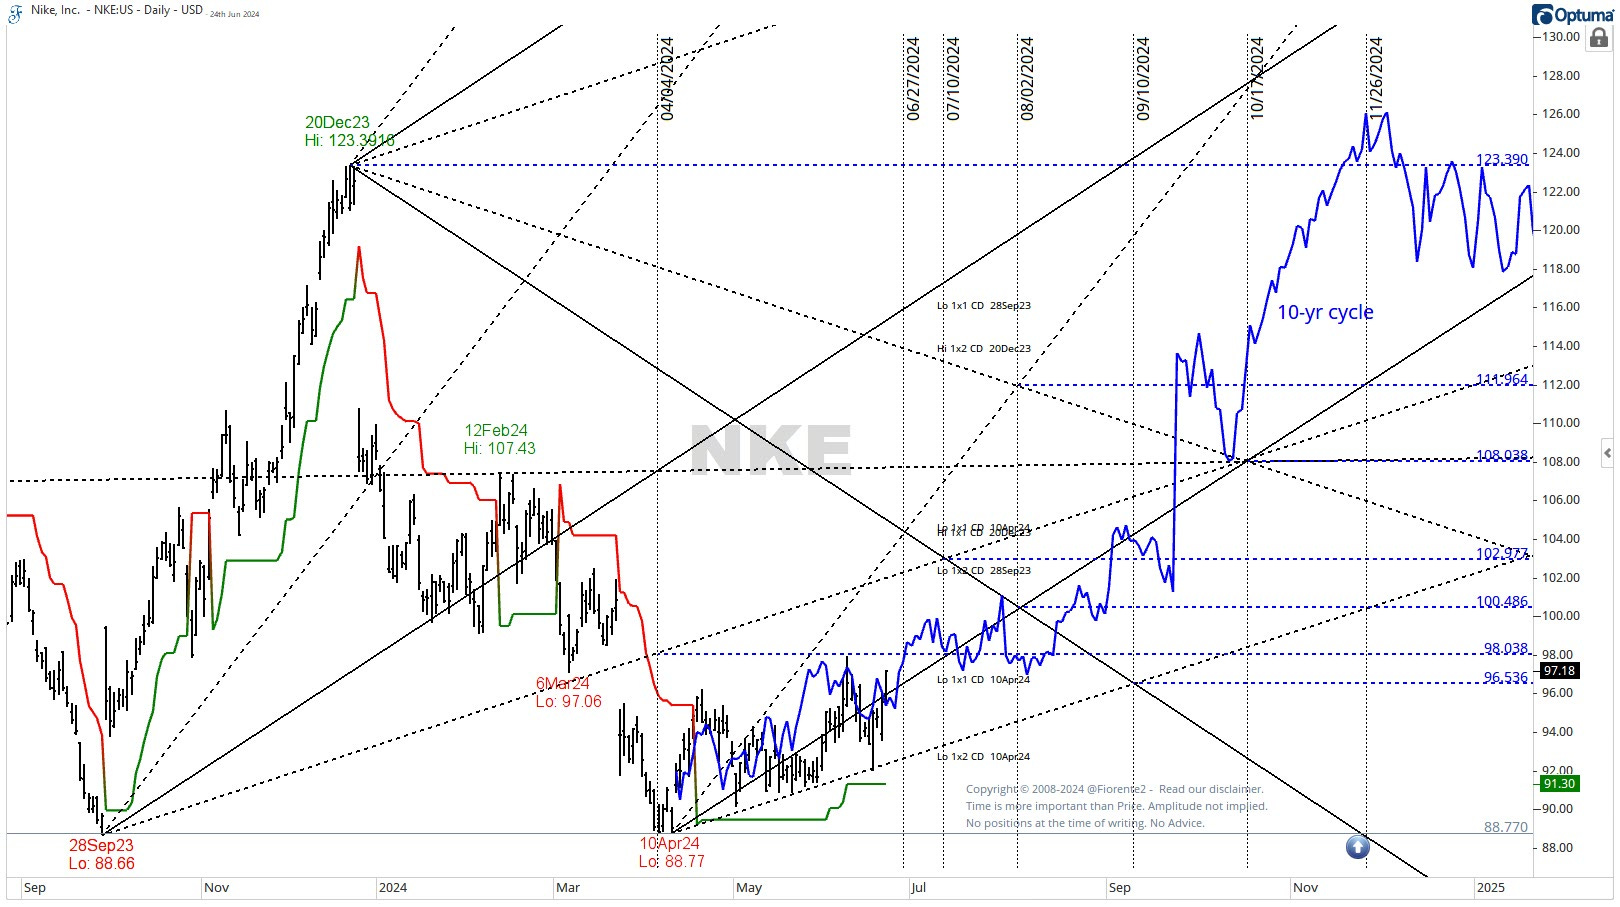
The stock experienced a decline from December 2023 to April 2024, but it now seems to be on the path to recovery, showing a pattern of higher highs and higher lows. There might be some resistance at $98.
Currently, it is trading above the 1x1 Gann Timing line (black, solid line). As long as the stock stays above the lower 1x2 (dashed black line), we may see it following the 10-year cycle. The 1x1 timing line, drawn from the December 2023 high, and the 1x2 timing line, drawn from September 2023, may intersect around July 10th, 2024. It's important to note that time is more crucial than price.
As of last Friday, the current stop loss is at $91.30 (indicated by the green solid line). While the stock has been following the 10-year cycle so far, it is not guaranteed that it will continue to do so in terms of time and price.
Note: I have just returned from a short break. As mentioned in last week’s post for the premium subscribers, the weekly post has been delayed to today. In today’s post on the US Indices, I will show the premium subscribers the long-term trend in the S&P 500, several years ahead, next to the weekly update several weeks/months ahead.