
US Markets Hit Key Resistance - Part II
#272 Latest Insights on US Indices and Key Trends in various Top 20 US Stocks

Introduction
The US Indices and many other indices and stocks around the world are hovering around key support and resistance levels. These levels align with planetary hotspots where support and resistance often occur. Price and Time on these levels are in balance, and when the financial markets hit these levels on important planetary cycles, the markets often experience a change in trend.
W.D. Gann was the first trader in the world to use the planetary resistance lines to detect where a change in trend may occur. He discovered that planetary time (longitude) could be translated into a price level at various harmonics. So, if Saturn is at 352 degrees, one could plot the Saturn level at $3.52/$35.2/$352/$3,520 or parts of it.
For slowly moving planets, such as Saturn to Pluto, the levels of planetary resistance often appear as horizontal lines. In contrast, for faster-moving planets like Mercury and Jupiter, these resistance levels are typically plotted across the chart and resemble to form a tunnel in the air.
In his work, such as The Tunnel Thru the Air, 1927, and in his Coffee-letters, he demonstrated the use of planetary lines and converting time (Longitude) to Price.
As illustrated in the chart below, the Heliocentric Longitude of Saturn (black) and Mars (red) at various Harmonic levels demonstrates how often a stock or index like the XLU ETF often respects these lines and bounces off to reverse trend.
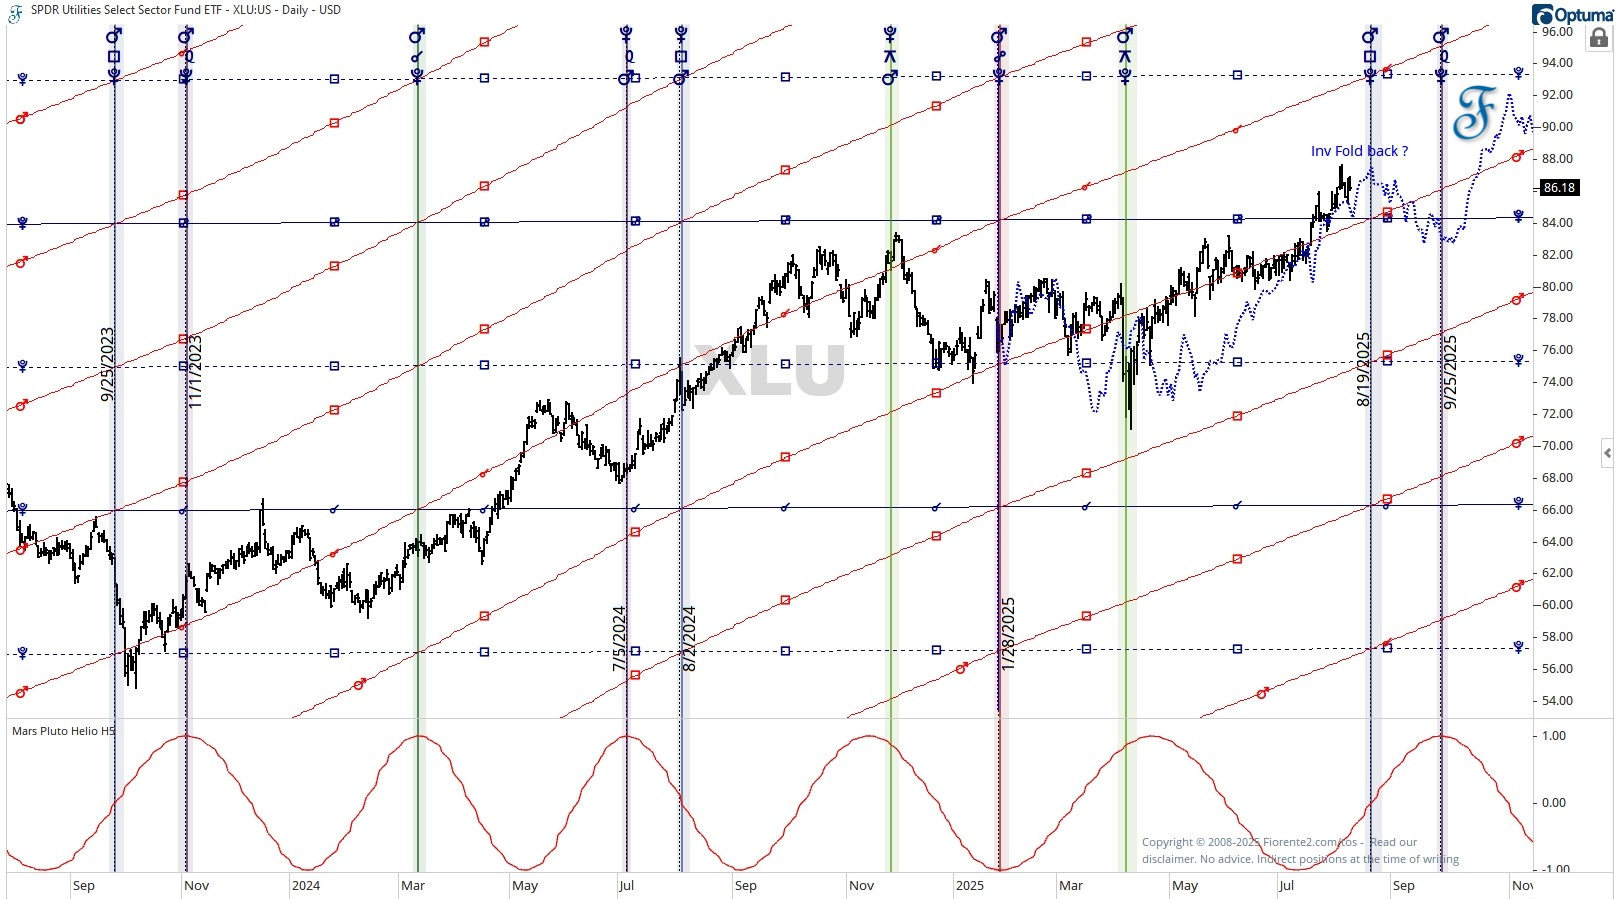
On these lines, time and price are in balance. As you can see in the past, the index can bounce off these planetary lines to move in the opposite direction, often finding support on the next level, but it can also hover around these lines for some time before a break to the upside or downside is made.
Therefore, bouncing off these lines or breaking through is not always certain; the trend change might continue. It's a good first step to stay alert and look for confirmation using other fundamental or technical indicators, such as a stochastic oscillator, RSI, or any other you prefer for trading.
I have plotted here the fifth Harmonic of the Mars-Pluto synodic cycle (Heliocentric) to illustrate how this cycle may be poised for a change in trend.
Similar planetary patterns are seen on most stocks and indices. In this post, we will examine the dominant planetary cycle and Gann Planetary lines for the US Indices.
I have updated some of the US Top-20 stocks that experienced Key bearish or bullish reversals in the past two weeks: AAPL, AMZN, JPM, GOOG, GOOGL, META, MSFT, NVDA, ORCL, and XOM. Additionally, I have included an update on the Gann Master Cycle charts for the DJIA & the S&P 500.