
US Markets Hit Key Resistance
#271 An update on the US Indices and update on key top-20 US Stocks Bearish Reversals

Introduction
Whilst most markets world wide have been running near old time highs we may be entering a period in which a rebound or change in trend is often observed. The markets last week seem to have reacted on the various announcements on the US levies, and key reversals in various US Top 20 stocks and world wide indices came up in my scans.
Traditional drawn trend channels over various tops or bottoms do not always indicate where trends may occur. They sometimes align with planetary hotspots where resistance or support may occur, but not always.
W.D. Gann in his work often translated planetary time (longitude) to a price equivalent to find these hotspots where Price and Time were aligned. In my scan last week most of the World Wide Indices hit planetary resistance based on these lines and equivalent price levels.
In his work such as a The Tunnel Thru the Air_1927 and in his Coffee-letters he demonstrated the use planetary lines and converting time (Longitude) to Price.
Like in the below chart the Heliocentric Longitude of Saturn at various Harmonic levels demonstrates how often a stock or index like the Nasdaq 100 often respects these lines and bounces off to reverse trend. On these lines time and price are in balance.
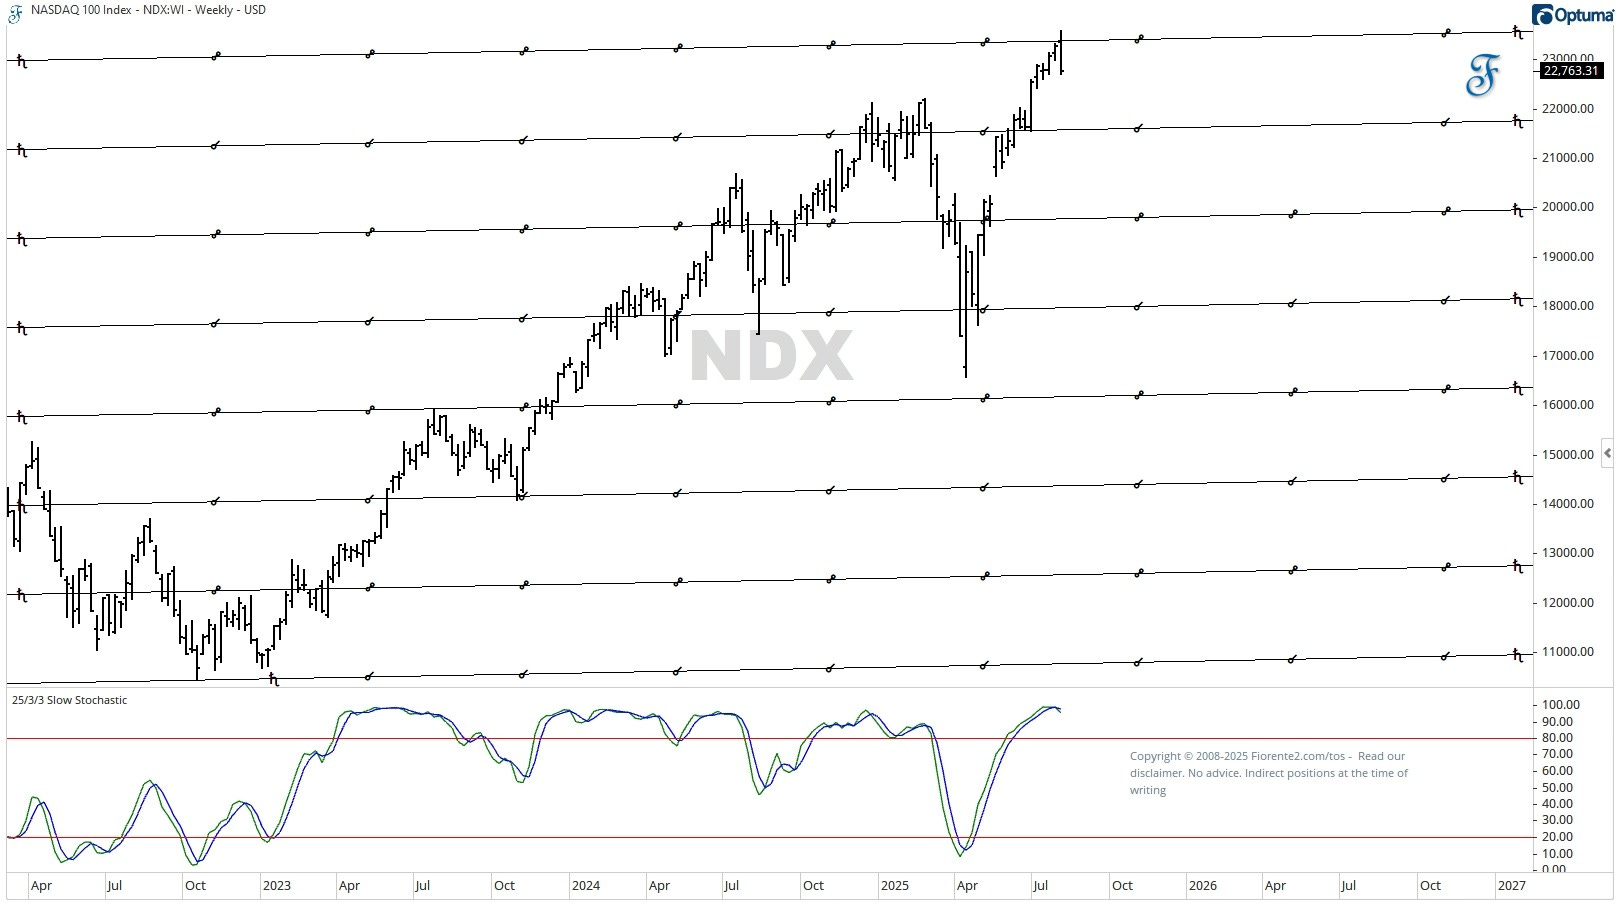
As you can see in the past the index can bounce off these planetary lines to move in the opposite direction, often finding support on the next level, but it can also hoover around these lines for sometime before a break to the upside or downside is made.
Hence bouncing off these lines, or breaking through is not always a guaranteed the trend change may continue. It is a good first start to be alert and seek confirmation based on other fundamental or technical criteria, like a stochastic indicator, and RSI or any other one you like trading best.
Similar is seen on most World Wide Indices, but in this post, we will examine the Gann Planetary lines for the US Indices and some of the of the US Top-20 stocks that experienced a Key bearish reversal at the same time: AAPL, AMZN, XOM, JPM, META, MSFT, NVDA and ORCL. Additionally I will include an update on the DJIA - Gann Master Cycle chart.