
$TSLA - The Mirror Doesn’t Lie
#302 | How a December 2025 cycle forecast called the TSLA decline and why Q1 earnings sealed it

Introduction
On December 31, 2025, I tweeted a TSLA chart with a mirror-image foldback drawn from the December 22 crest. TSLA was trading around $465 at the time.
It’s at $373 today. Close to 20% lower in less than four months, without a single new forecast needed.
TSLA - The December 22 Crest Forecast
On December 30, 2025, Michael Burry called TSLA 'a ridiculously overvalued stock.' My cycle forecast from the December 22 crest, posted the following day, confirmed the direction (from a different analytical angle).
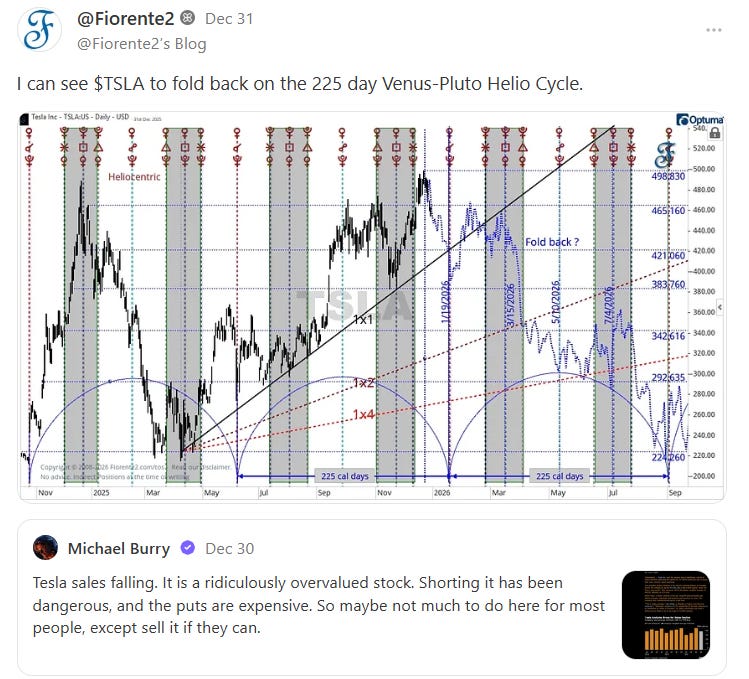
This daily chart was built around heliocentric aspects, gray shaded columns marking major planetary time confluences, with three Gann angles rising from the 2025 low: a 1×1 primary trendline and 1×2 and 1×4 trendlines acting as dynamic support on the way up.
A trend below each of these lines is bearish, and usually the trend may continue, once broken to the next lower trendline. On each of these lines Price and Time are in balance and may act as inflection points.
At the bottom of the above chart, three almost 225-calendar-day cycles were drawn from the Venus-Pluto Helio conjunctions. The number wasn’t chosen at random. 225 days is a Venus cycle period. The projection mapped 225 days of time to $224 in price. Price and time squaring.
The stepped targets on the right side: $465.16 → $421.06 → $383.76 → $342.62 → $292.64 → $224.26.
By April 24, price has already worked through $465, $421, and $383 and is now in the $342–$374 zone, right where the 225-day cycle said it would be. The $292 and $224.26 levels are the next major targets. August - September 2026. 225 days, 225 in price.
TSLA - The April 7 Weekly Update
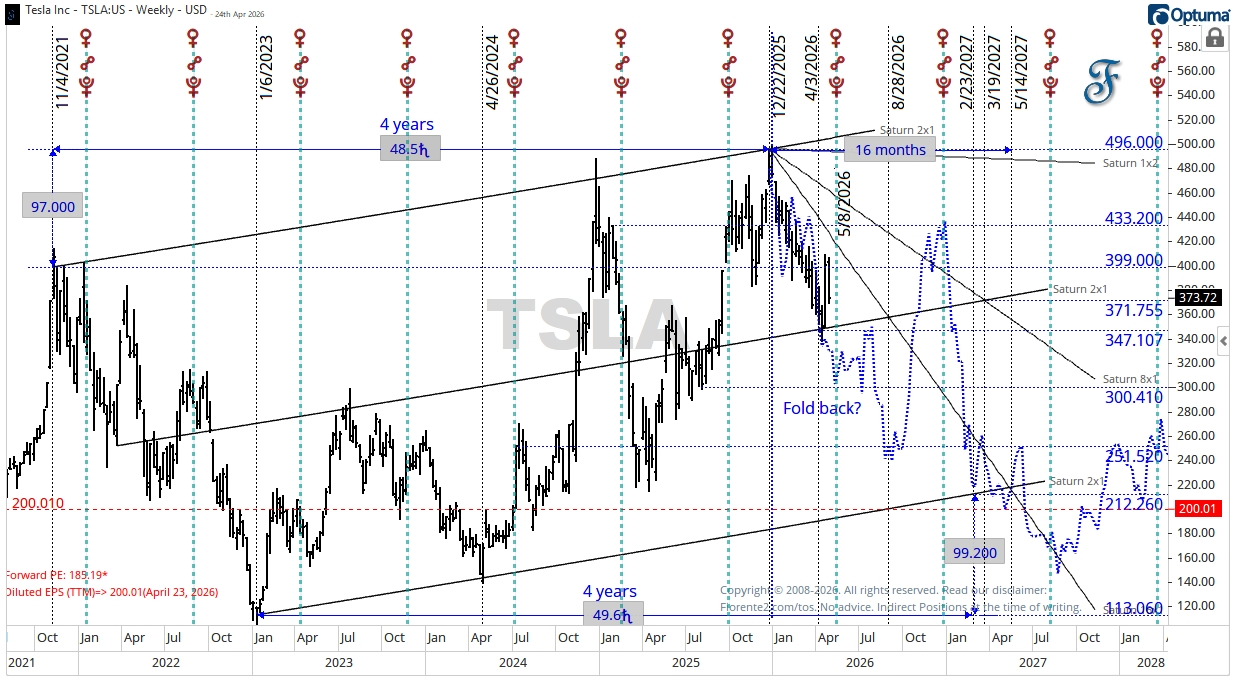
The weekly chart shows Saturn planetary timing lines and the 4-year cycles as a second analytical layer.
Two vertical markers flagged the 4-year cycle, one at the 2024–2025 high (4 years, 48.5 degrees of Saturn), one at the 2022 low (4 years, 49.6 degrees of Saturn). TSLA has tracked this rhythm with quite a bit of regularity. Always watch trends to change around 49 days, weeks, months or degrees. 49 is 7x7 and it is called the death zone on which trends may change.
The diagonal Saturn 2×1 and 1×2 timing lines sat below price as dynamic support. A mirror-image foldback was drawn in blue from the $496 high, with horizontal confluence levels stacked below: $433.20, $399.00, $371.75, $347.11, $300.41, $251.52.
By April 7th, TSLA was sitting just above the Saturn timing line near $350–360. The question the chart posed: would that price/time balance hold, or would the foldback take over?
The Q1 2026 earnings provided the answer.
The Q1 2026 Earnings: What Changed
TSLA reported on April 22.1 The operational side looked solid:
EPS $0.41 (vs. ~$0.36 expected)
Revenue $22.4 billion (+16% year over year)
Auto gross margins 19.2% (up sequentially)
Energy storage margins 39.5% (record)
GAAP net income $477 million; GAAP net margin 2.1%
The forward guidance and the 10-Q told a different story:
CapEx raised to over $25 billion for 2026 (from ~$20 billion prior)
Free cash flow expected to be negative for the rest of 2026
Hardware 3 confirmed unable to run unsupervised FSD; hardware upgrades or trade-ins required across a large part of the existing fleet
~50,000 more cars produced than sold in Q1; inventory at 27 days of supply, up from 15 days
The primary driver of the operating income improvement: one-time warranty and tariff benefits; strip those out and the 2.1% GAAP net margin is the real picture
Reported by Electrek: a $2 billion acquisition of an AI hardware company, more cash deployed before the heavy CapEx cycle has even started 2
The stock sold off 3–4% in the days that followed. A forward P/E of 189× doesn’t leave much room for a $25 billion cash-burn narrative. The Saturn timing line gave way.
Where the Chart Stands Now
TSLA is now sitting just above the Saturn 2×1 timing line near $371–374. The $348 price level at the horizontal Saturn 2x1 timing line is a potential near-term inflection point. A short sideways move from here wouldn’t surprise me following the foldback pattern. Remember: Time is more important than Price.
So far, the December 22 daily chart called this level four months ago as you can see on the below weekly chart.

Price closed at $373.72 on April 23. The “16 months” annotation on the above updated weekly chart tracks time from the $496 high toward the lower diagonal 2x1 Saturn line in March - May 2027. The blue foldback projection is following its drawn path closely. If the foldback continues, the path between now and spring 2027 may even become volatile by the end of August 2026.
The Daily chart below shows a potential similar foldback, with the 1x2 calendar day timing line acting as support for now. Once it goes through you may expect a further tumble into the $290-$300 price level by July 2026 and on its continuation to a price level of $225, where price and time align at the conjunction of the Venus-Pluto synodic cycle.
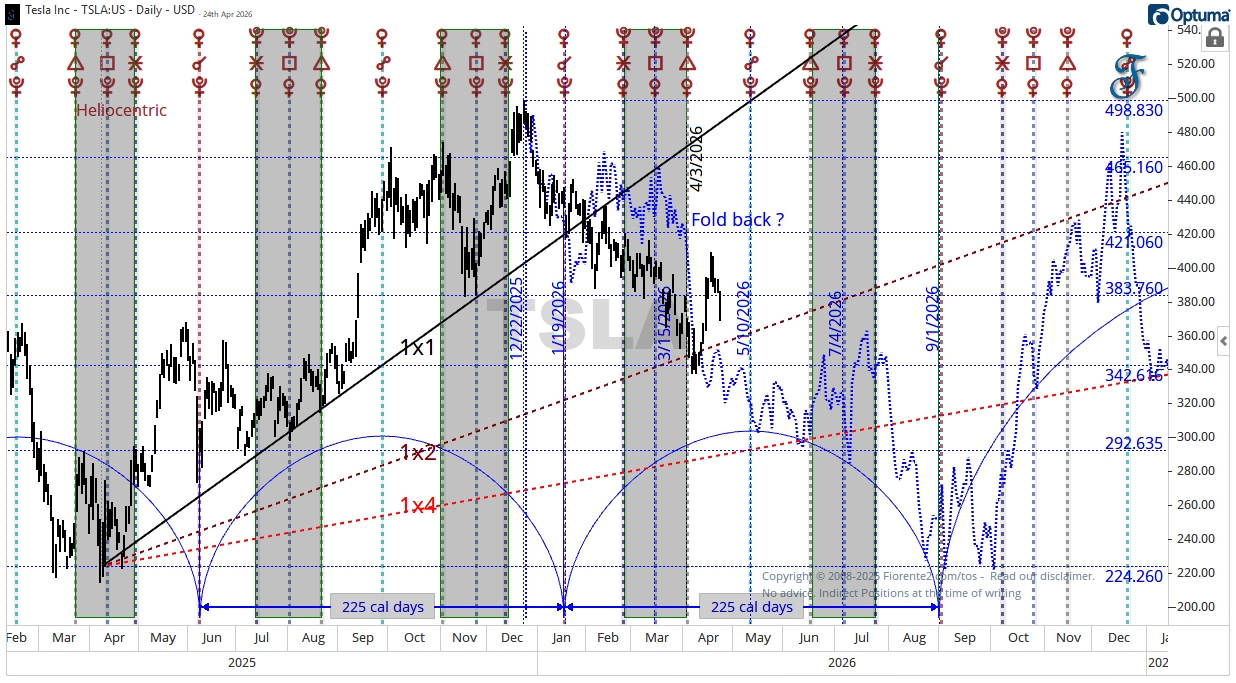
The Next Confluences
Near-term: $300.41. The Saturn 8×1 angle and the horizontal level from the weekly chart converge here. First major target below current price.
August-September 2026: $224.26. The 225-day Venus-Pluto cycle from the January 2026 conjunction maps 225 days of time to $224-$225 in price. That's where price and time square next, or so the cycle suggests. The step progression from the daily chart: $342 → $292 → $224 points to the same zone.
July 2027: $150. The Venus-Pluto helio cycle adds a longer-term projection. That’s a long road with several potential inflection points along the way, and I honestly don’t know if it plays out. The cycle has been precise enough so far to take it seriously. It can also invert.
Each level is a potential place for the foldback to slow, pause, or reverse entirely. These patterns always stop working at some point, usually when you’re most convinced they won’t. Always watch the chart in front of you.
Conclusion
A forecast drawn on December 22, 2025 has tracked TSLA lower by close to 20% in four months. The Q1 2026 earnings delivered the fundamental weight that broke the 1x1 calendar day timing line support on the daily chart and confirmed the foldback already in motion.
If support breaks the Saturn 1x2 timing line, my near-term price target is $300. By August-September 2026: $224.26, where 225 days of time meets $224 in price on the Venus-Pluto synodic cycle. By July 2027: $150, if the Venus-Pluto cycle runs its course.
This is my bias for now. (No advice.)
Remember, cycles can contract, extend, and invert. I may be wrong, of course. Anomalies can occur, fundamentals can shift, so be cautious.
In case you haven’t noticed, I post various charts in the Substack notes every week. You can find them all here. (click on the link)
P.S.: Occasionally, I share new analyses exclusively for free subscribers. Subscribing gives you email updates on these posts, plus extra insights and deeper research from the time you join onward; past analyses are not included.
If you liked this post from @Fiorente2’s Blog, why not restack and share it?
© 2008–2026 Fiorente2.com. All Rights Reserved.
Disclaimer: This analysis is for informational and educational purposes only and should not be considered investment advice. Read our full disclaimer.
Disclosure: From time to time, I may hold positions in the securities mentioned.
Sources:
Tesla Releases First Quarter 2026 Financial Results - Tesla Investor Relations
Tesla First Quarter 2026 Production, Deliveries and Deployments - Tesla Investor Relations
Q1 2026 Earnings Consensus - Tesla Investor Relations
Tesla SEC Filings - Tesla Investor Relations
Tesla quietly discloses $2 billion AI hardware acquisition - Electrek
The Q1 2026 10-Q has not yet been officially filed on SEC EDGAR at the time of writing (typically due early May 2026). This item was reported by Electrek based on preliminary filing disclosures. Treat it as unconfirmed until the official 10-Q is available.