$TSLA - From IPO Price & Time to Future Price & Time Targets
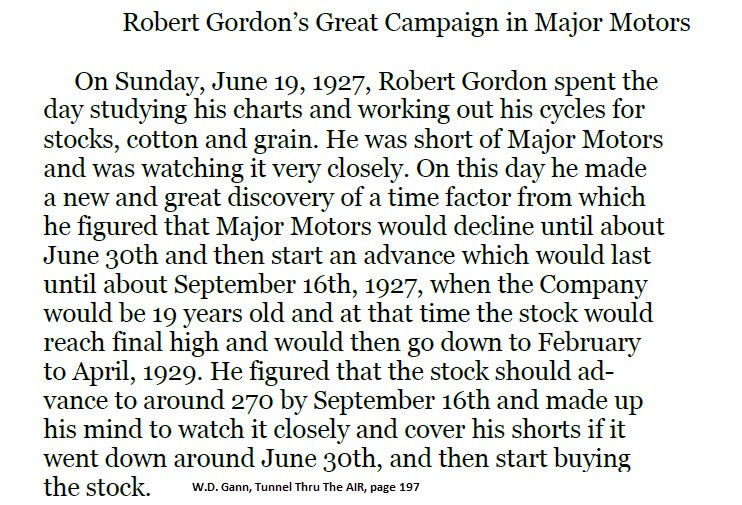
#201 Revisiting W.D. Gann's “Major Motors” trading example.
Introduction
$Tesla (TSLA) has been keenly following Venus and Mars cycles since August 18th, 2024, showing a mirror-image foldback (dotted blue line in the below chart). Yesterday, July 11th, 2024, TSLA dropped from $271 to $241. The stock appears to have difficulty breaking the $270 price level.
What is a probable explanation for the recent decline?
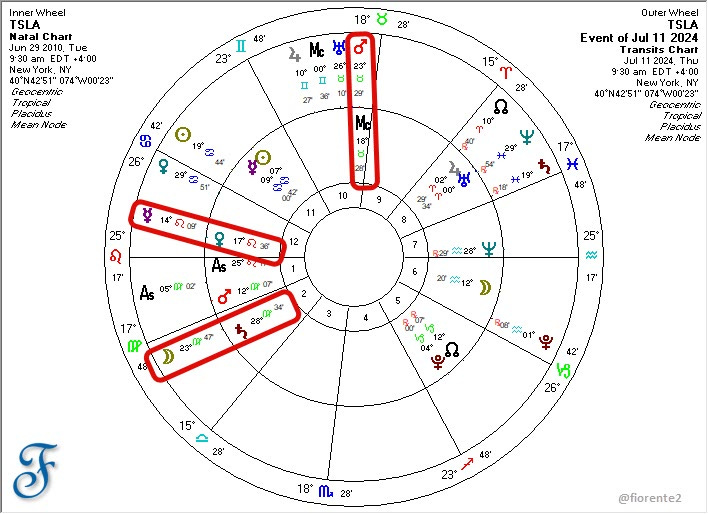
From a planetary and time cycle perspective, it is remarkable to see that Tesla declined on July 11th, after Mars passed TSLA’s natal Midheaven, Mercury passed natal Venus, and Moon passed natal Saturn (father time), all signaling time was up for the moment.
TSLA - IPO date
There are interesting similarities in the stock's behavior around June 29th, 2024, and the IPO date of TSLA in 2010, when it was priced at $17 (pre-split). Note the similar acceleration around June 29th this year compared to two years ago. Perhaps @elonmusk may have chosen this date deliberately.
June 29th is remarkable as it is the day hinted at in a trading example involving a fictional automobile company called "Major Motors" in W.D. Gann's novel "The Tunnel Thru The Air." (1927). This link may have been known to Elon Musk. The IPO date of TSLA fell between a lunar and solar eclipse, and the date in Gann’s example was 1 day after a solar eclipse, June 29th.
TSLA & Eclipses
As in #GANN's example, it's intriguing that TSLA's trends may change around lunar and solar eclipses and their midpoints (Sun square Moon’s Mean Node). This aligns with the solar and lunar energy present during TSLA's IPO, leaving an impression that could be repeated.
TSLA - Support and Resistance
Additionally, TSLA’s support and resistance levels on the Square of Nine (SQ9) are at the same angle as the IPO price of $17. Looking at past support and resistance levels, trading algorithms may be set to operate in multiples of squares. See the below and also the first chart.
The recent price level on July 11th, at $270 may represent a significant milestone, especially considering its proximity to the solar/lunar eclipse midpoint on July 2nd, 2024. Despite this, a trend change is not always guaranteed and could be temporary. The stock might still trade higher into mid-September/early October 2024, particularly with the Robotaxi announcement planned for August 8th, 2024.
Robotaxi announcement - August 8th, 2024
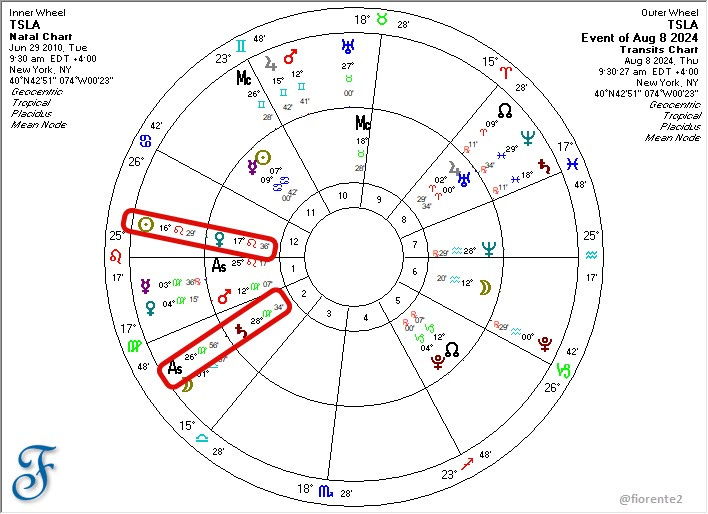
What’s so special about August 8th, 2024? Why did Elon Musk choose this date? Is this just a random date, or was it deliberately chosen? Let’s look at the natal chart vs. the planetary bodies' position on August 8th, 2024.
This day may be important because the Sun passes over TSLA’s natal Venus, and the Ascendant passes over TSLA’s natal Saturn. With Venus symbolizing value and Saturn symbolizing father time, investors may better realize the potential value of TSLA and that it is about time for a change in trend, this time energized by the Sun and the Ascendant.
Time Cycles
Looking at time cycles, by analyzing price and time, potential future inflection points may be uncovered. For example, 144 calendar days from the April 2024 low point converge on September 10th, 2024, which may align with levels seen two years ago at around $288/$289 (2x$144/square of 17). This also marks 270 trading days from the inflection point of the foldback on August 18th, 2023. Squaring price and time is a useful technique Gann promoted.
It's important to exercise caution when relying too heavily on the fold-back scenario, as market conditions and economic cycles change over time. Cycles can contract, extend, and invert. Time is more important than Price. As a result, we might anticipate a drop in TSLA's stock price leading up to August 8th, 2024, alongside a more general decline in other stocks. Price levels of $225 and $196 are worth considering.
Conclusion
Elon Musk's upcoming announcement on Robotaxi could incite excitement among TSLA investors. A price target of $324 may be considered to continue the trend, as it is the square of 18. When reduced to a single digit, the sum of these numbers is 9, which may indicate the end of a cycle. As mentioned a revisit to the levels seen two years ago at around $288/$289 (2x$144/square of 17), may do as well, squaring the low of April 2024.
In a bullish scenario, a peak may occur around early August to early September, but a low in August and a crest around mid-to-late September towards October 2024 may also fit with the upcoming lunar/solar eclipse of September 18 and October 2, 2024.
Disclaimer: This analysis is intended for informational & educational purposes. and should not be considered as a solicitation to buy or sell stocks or any financial instruments. It is important to conduct your own research and consult with a qualified financial advisor before making any investment decisions. Please take a look at our full disclaimer. (Click on the link)
Disclosure: No positions in TSLA at the time of writing.
At the time of writing on July 12th, 2024, TSLA was trading at $249.
This article was first published on Twitter on July 12th, 2024.


will closely monitor this symbol. nice info.