
Trading Fibonacci Harmonics
#249 An update on US Indices: Nasdaq, S&P500 and DJIA.

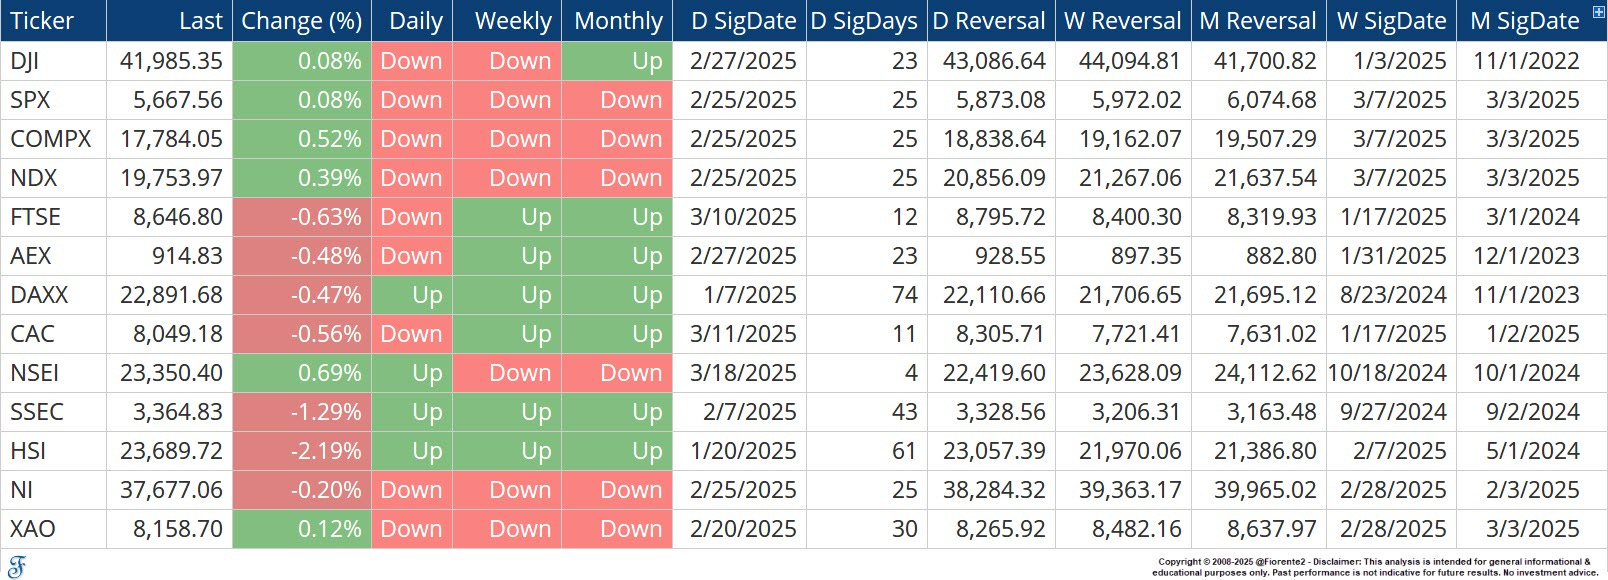
Most of the indices around the world are still trading below their daily, weekly, or sometimes monthly breakout and reversal levels. As long as these levels are not breached from below, this signals the downtrend from the highs in January or February may not be over yet.
This week, I noticed an interesting Fibonacci Harmonic Pattern may be emerging in the US Indices. Did you notice that from the high on February 19, 2025, to the low on March 14, 2025, this period was exactly 21 calendar days? A Fibonacci number. Often, the next inflection point could be followed by a Fibonacci number close to the next or previous number in this sequence.
The Fibonacci sequence is closely related to the Golden Ratio, also known as the Golden Mean, which is approximately 1.618 (or its inverse, 0.618). In nature, everything evolves along the Golden Ratio, and this is often reflected in the stock market as well.
Therefore, a low after 21 calendar days could be followed by a rebound that reaches its high after 34 calendar days (from the February high), which is 13 calendar days later than the March low. This completes a 13, 21, and 34 sequence—a Fibonacci Harmonic Pattern or Symmetrical Pattern.
There is more to say on this.
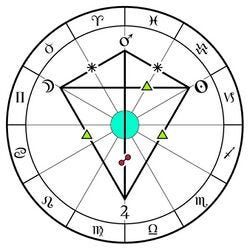
Connecting the dots of a potential future path, I see a few intriguing planetary formations known as the Kite formation, which links past lows to future potential highs and lows. On the chart, connecting the distances between possible inflection points using the Fibonacci sequence establishes a Kite pattern. As the saying goes: “As above, so below.”
In this post, I will show premium subscribers how the US indices might evolve into a future low, following the upcoming Fibonacci inflection points that could lead to these Kite formations in May and June 2025.