
The Stock Market & Economy
#256 An update on the main trends in the US indices: Nasdaq, S&P 500, DJIA

Introduction
Last week, I “tweeted” the chart below, arguing that the 7-year Shemitah cycle aligns with severe recessions and declines in Gross Domestic Product, a key economic indicator. So far, US GDP doesn’t indicate an impending recession. Thus, the stock market may not currently reflect the state of the US economy.
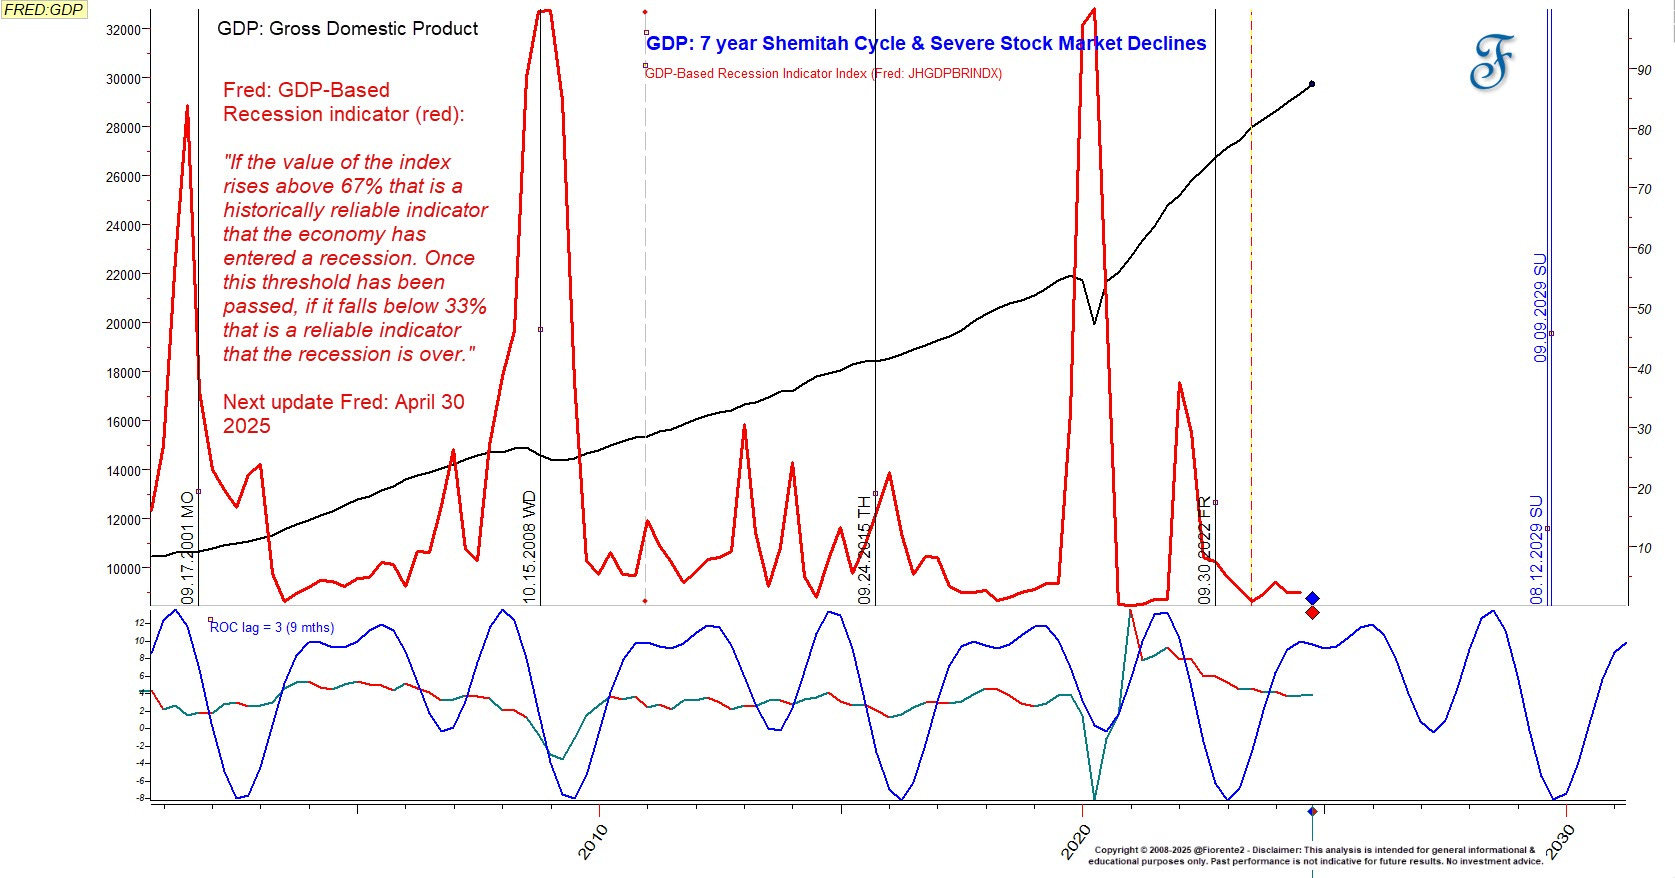
The Fed’s threshold for a recession is when the value of the GDP-based indicator (red) rises above 67%. However, the GDP’s rate of change (blue: with a 9-month lag) is slowing, and a minor decline or recession may occur in 2026. Note: Severe declines in the GDP rate of change (blue) often follow the 7-year Shemitah cycle (2001, 2008, 2015, 2022). A potential drop in 2028-2029, a Shemitah year, could be (more) significant.
The current stock market declines may be attributed to the uncertainty surrounding US economic policies and the potential economic challenges. Of course, severe levies will affect the overall economy over time.
Will the US President gradually retract the severe levies he mentioned earlier? That would favor the overall stock market returning to its all-time highs by the end of the year.
Most worldwide indices passed their daily breakout and reversal levels last week, so the first signs of some recovery to higher altitudes may have been set.
This year, the 99-year cycle, which is a 3x33-year cycle, has a nearly 89% correlation with this year's stock market. The significance of this cycle is that the 33-year cycle returns to the same degree of the zodiac every 33 years, almost within 20 seconds, every repeat.
This makes me optimistic that a potential low may have been set for the year, but if this cycle continues shortly, we may see one more decline along this cycle.