
The Significance of Price and Time
#275 Latest Insights on US Indices and Key Trends in various Top 20 US Stocks

Introduction
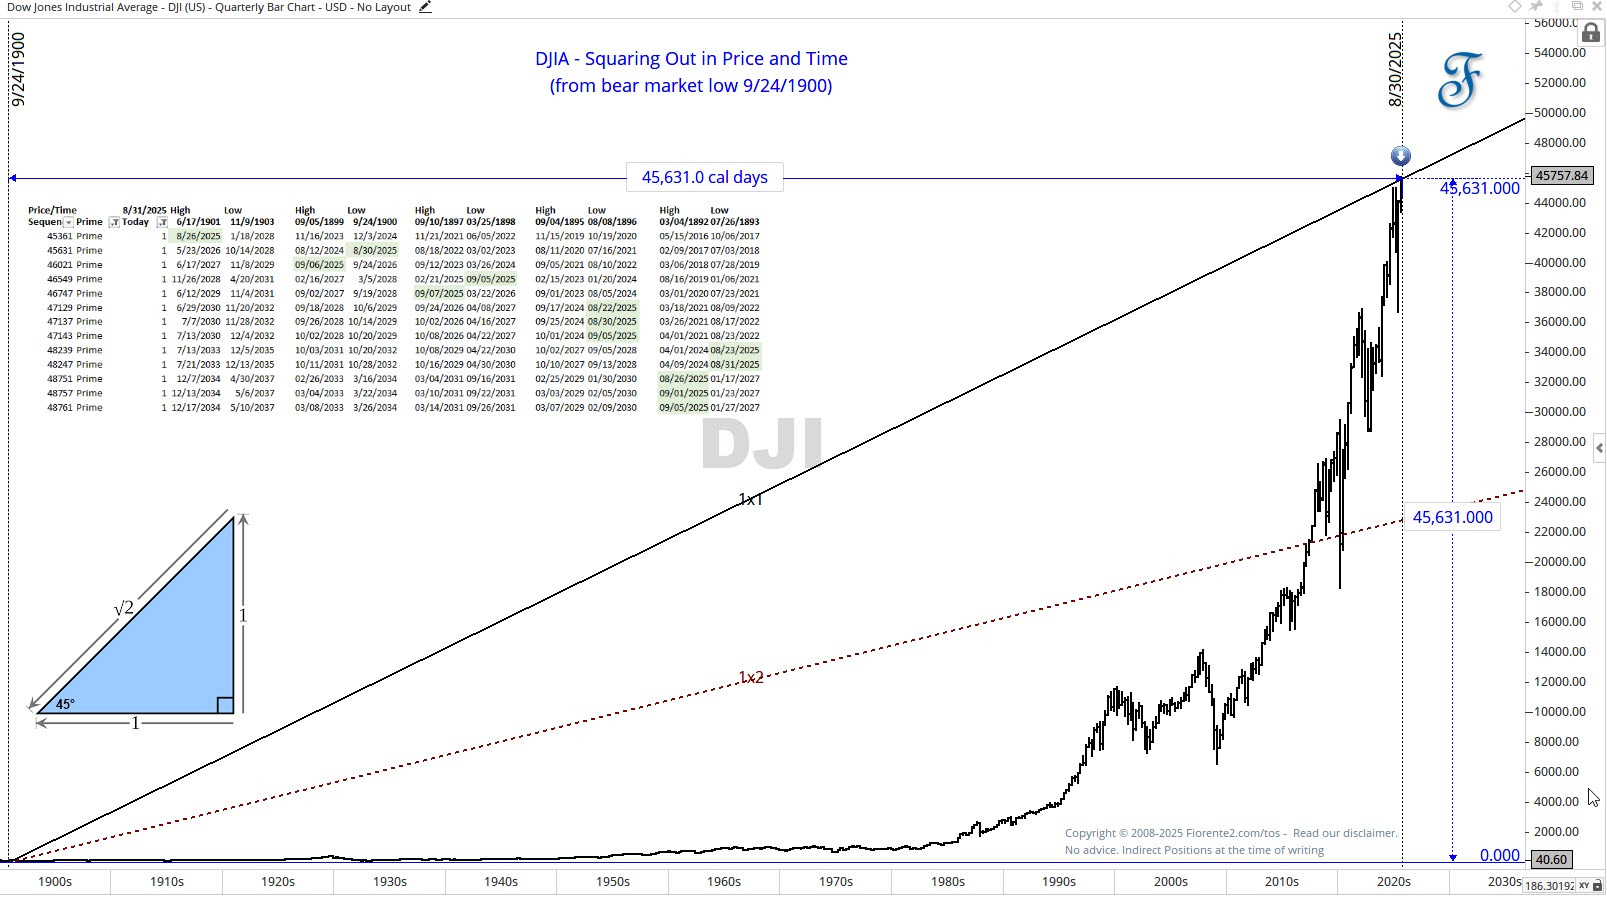
For the first time in history, the DJIA has squared out in both price and time from its bear market low of September 24th, 1900, in 45,631 calendar days at a price level of $45,631. Considering the span of 125 years, this point marks a highly significant market hotspot.
In Gann terminology, "squaring price and time" refers to a balanced or harmonious relationship between the price and time dimensions, often indicating significant market reversals. Price and Time are interchangeable.
Drawing timing lines is not an exact science, but it helps identify potential future inflection points. However, it is always necessary to confirm this with other methods, such as planetary cycles, indicators, or fundamentals.
Last week, the DJIA reached the 45,631 level, which occurred two days before the expected square-out date on August 30, 2025, after 45,631 calendar days had elapsed. The square-out at 45,631 is significant because it is a prime number, emphasizing its importance on the 1x1 line, as it cannot be divided into smaller cycles that also “square” both price and time.
This does not necessarily mean that the bull market is over, as the 1x1 line continues on its path; however, this 1x1 line can represent significant resistance for some time to come. When broken, other past highs and lows may become more relevant, and we may see an even higher 1x1 timing line. On the chart above, I have included some relevant prices and future time dates, referencing past market highs and lows, as well as future dates.
The S&P 500 exhibits similar square-out points in terms of time and price, and the NYSE Composite Index is close to a square-out on the 60-year Gann Master Cycle.
While analyzing the NYSE chart using planetary cycles of Venus, Mars, Jupiter, and Saturn, we might be approaching a trend reversal, although it could still take a couple of months. So, let’s observe how this aligns with these key planetary cycles….
Additionally, in this post, I have updated the 60-year Gann Master Cycle Chart for the DJIA and the S&P 500, and provided an update on the top 20 US stocks.