

Introduction
The Philadelphia Semiconductor Index (SoX) and NVIDIA Corporation (NVDA) have been retracing like a mirror image of the uptrend since the highs in 2024, as mentioned in my previous update from early March.
You can see that most of the well-known companies in the semiconductor industry are following a similar path.
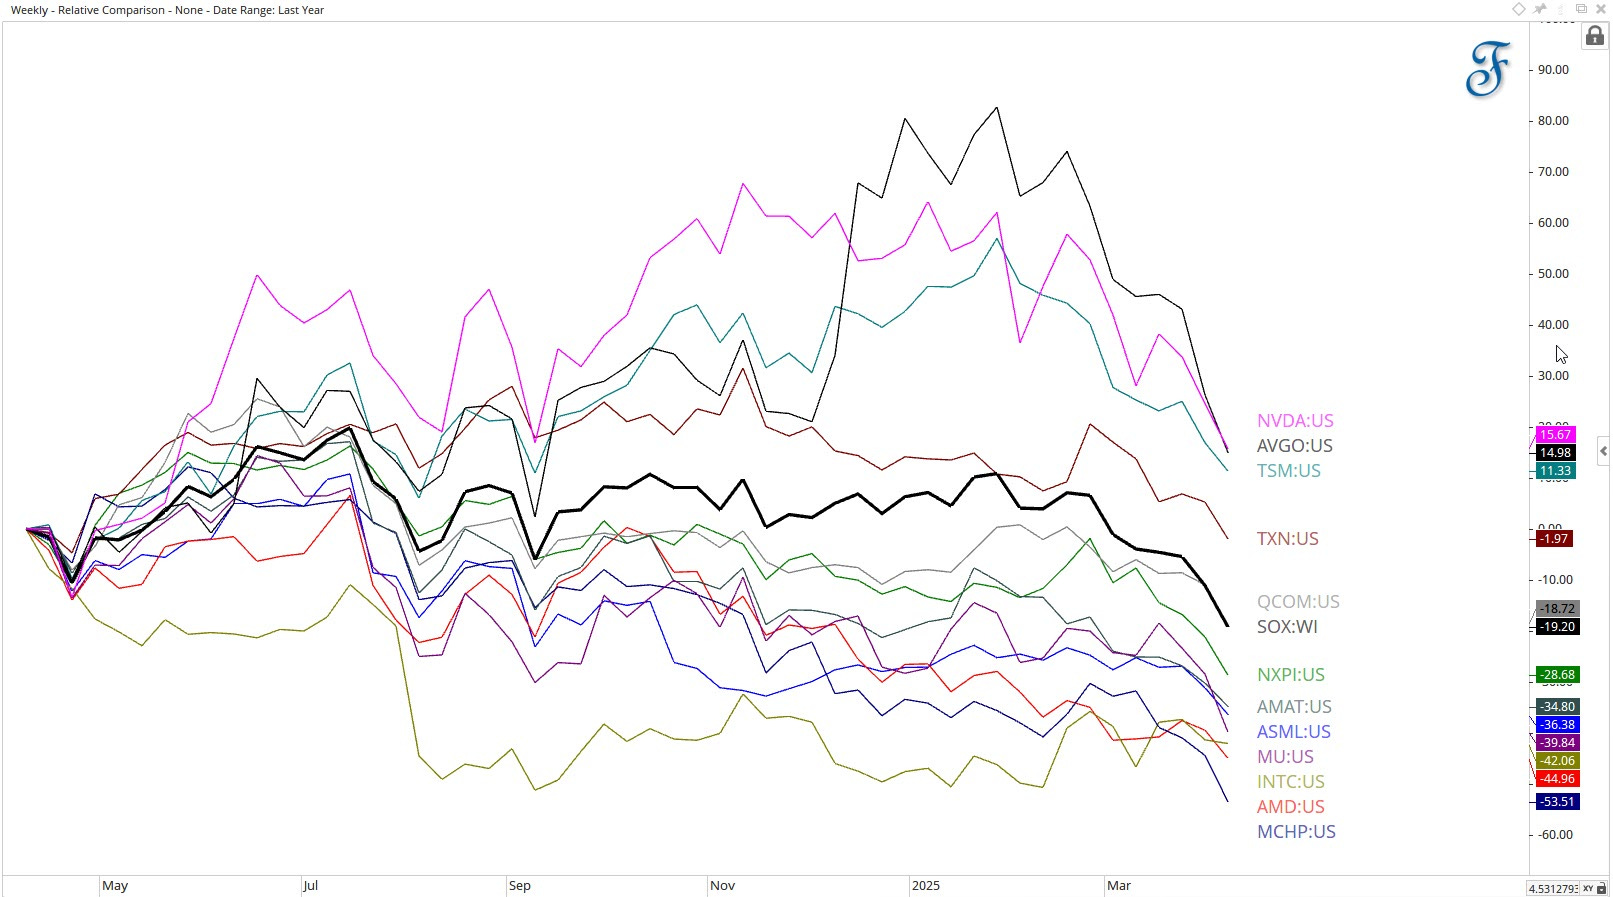
Most of the companies in the chart above are trading lower than they were 52 weeks ago, with well-known companies like AVGO, NVDA, TSM, and TXN still holding above their 52-week lows, but declining fast. We have yet to see the lows for these companies.
The broad semiconductor SOX index is trading within a trend channel defined by the parabolic trendlines (blue), as shown in the chart below. The parabolic trendline at the top is similar to the one that started at the March 2020 low. I plotted a mid-channel parabolic trendline in dashed blue.
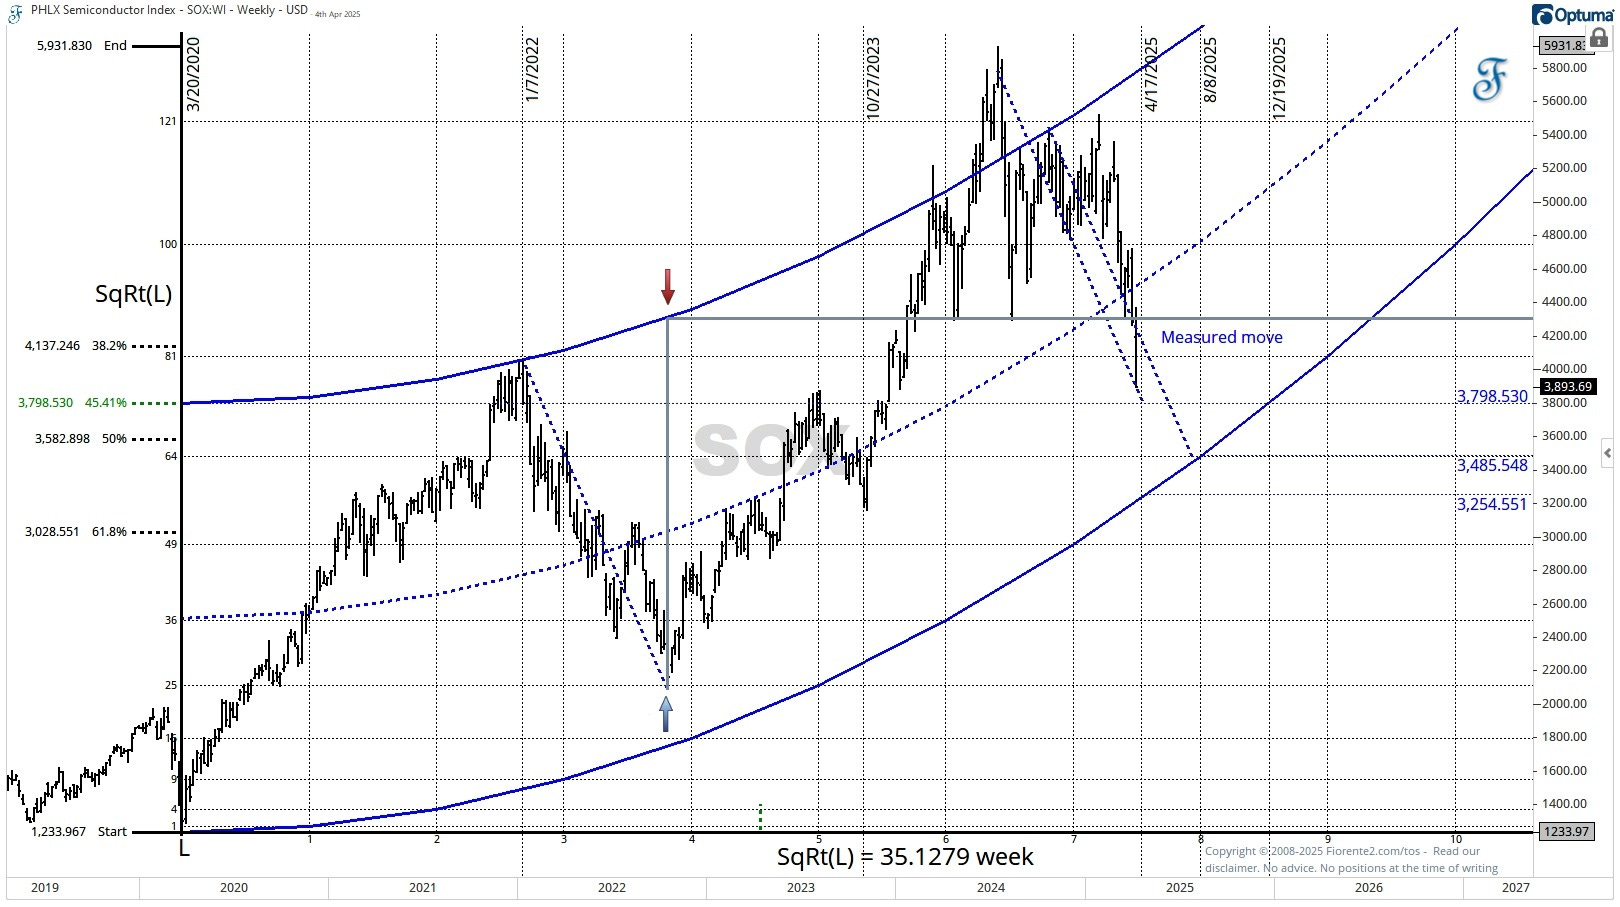
The parabolic trendline is based on the Price/Time formula indicated on the chart. The time is defined by the Square Root (SqRt) of the low.
Currently, the SOX index is trading below the support level (grey line) that corresponds to the 2022 low in both price and time and seems to be heading toward the lower parabolic trendline, measured from the March 2020 low. The measured move may indicate where price and time are likely to align in the near future.
Will the semiconductor industry continue on its decline or are we close to relevant support levels in price and time? In this updated post, I will further explore the potential price and time forecasts for the Semiconductor SOX Index and NVDA.