The NYSE Natal Chart: Revealing Future Mass Pressure in the US Indices 232 Years Later
#206 Enhancing our Forecasting Models and Exploring the Influence of Planetary Alignments on Financial Markets
Introduction
Astrology has piqued the interest of both astrologers and financial analysts. It has shown the potential to forecast future movements in the stock market with surprising accuracy based on celestial bodies' positions and their influence on human affairs. When applied to financial markets, astrological analysis seeks to identify potential trends and turning points based on planetary alignments and their impact on human behavior and market psychology.
The famous banker J.P. Morgan used to say: “Millionaires don’t use astrology, billionaires do.”
Renowned astrologers and traders such as W.D. Gann, Louise McWhirter, Donald Bradley, and David Williams, as well as contemporary practitioners like Alphee Lavoie, Michael S. Jenkins, and Raymond Merriman, have successfully used astrology to forecast future market movements.
While finding a consistent model over time is challenging, advancements in technology, such as computers and artificial intelligence, have made it easier to identify key aspects that may provide insights into future stock market movements.
I have been working to improve my artificial intelligence model that uses statistics on past planetary aspects to forecast future market direction. Considering the limitations of the earlier model, including its use of polarity and valuation of various aspects, I revisited the works of the old masters and improved the model by using the NYSE natal chart as a basis. W.D. Gann, McWhirter, and many others have been known to match future price and time inflection points with planetary aspects from various natal charts or important events.
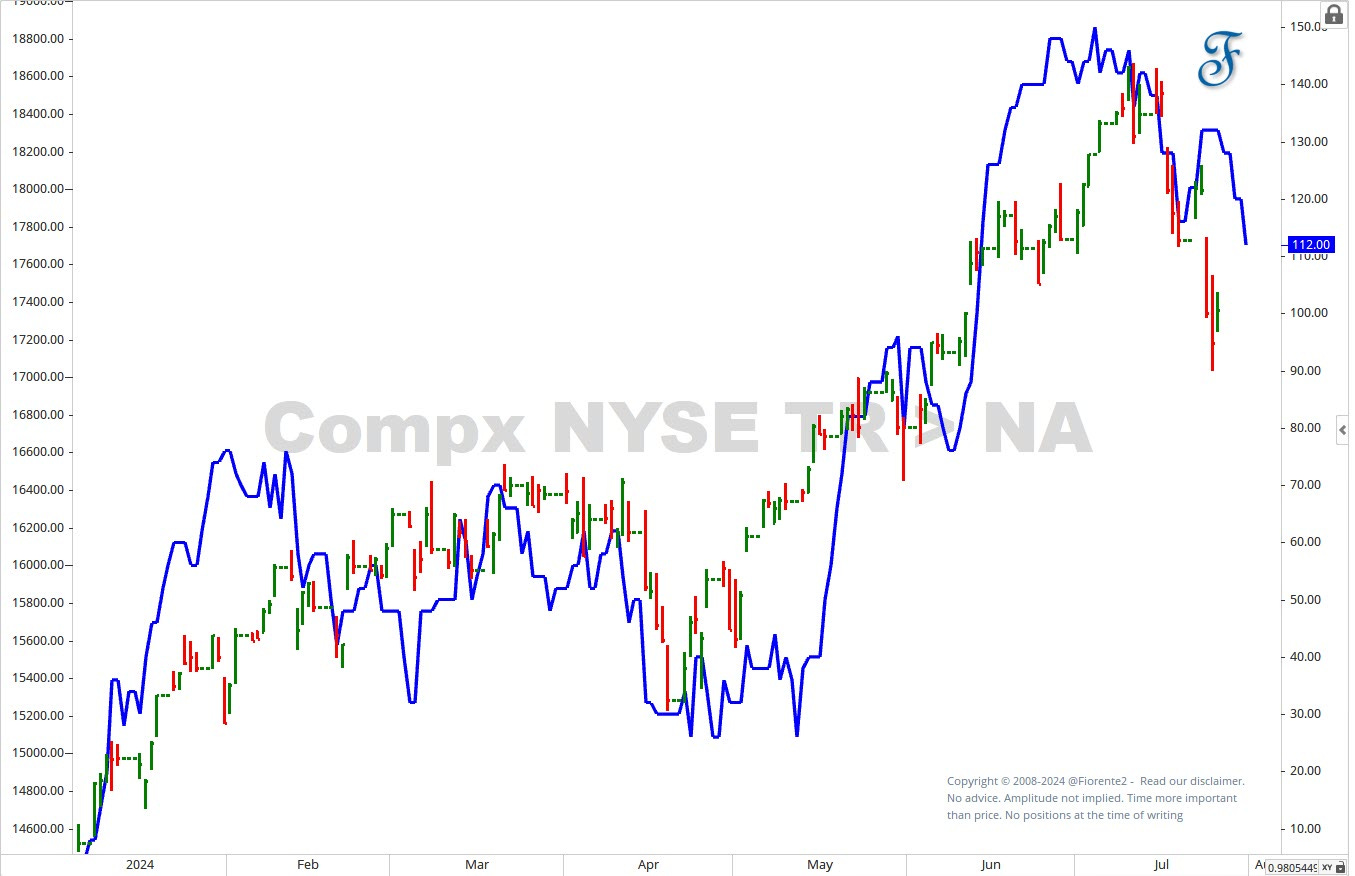
Using a planetary transit-to-natal analysis, I have built a model to forecast future inflection points based on the planets' positions compared to their positions at the time the NYSE was born in 1792. The model leverages the differences in polarity and valuation of future aspects known to be more bullish or bearish. As you can see in the chart below, this model currently shows an 87.7% correlation with current market dynamics on the Nasdaq Composite.
Applying the same NYSE Transit to Natal model to the SPX and the DJIA also shows excellent correlations. The correlation with the SPX is 81.1%, and with the DJIA is 57.6%.
The updated model has shown a strong alignment with current market trends, although it may not encompass all possible variables and anomalies. It outperforms the Gann Mass Pressure model by utilizing actual planetary time cycles rather than traditional calendar years.
Unlike the Bradley Model, which has a similar basis, it does not appear to invert as frequently. Moreover, the model is constructed using non-stock market correlated data and has not been trained to any particular stock market index. The enhanced model is automatically interpreted, potentially reducing the likelihood of human errors or omissions.
I will use this model to establish a direction bias on a month-to-month basis. Today, premium subscribers can already access the August forecast for the Nasdaq Composite, the S&P 500, and the DJIA behind the paywall. Additionally, I will provide a forecast for the Nasdaq Composite, SPX, and DJIA until the end of the year as part of the Stock Market Outlook 2024. In the meantime, I will be working on similar models for all asset classes I follow, which will serve as the basis for future forecasts.


