

Introduction
Some analysts suggest BTCUSD may have peaked and “should decline well over 40% in the next six months”, but I’m not convinced yet, as it remains within a long-term channel on the weekly log chart. We are now approaching a Jupiter Retrograde period. Bitcoin has often shown trend reversals during Jupiter Retrograde, often with significant volatility.
Bitcoin - Weekly Log Chart
In the weekly chart below, on a log scale, I have drawn the long-term channel that Bitcoin (BTCUSD) is trading in.
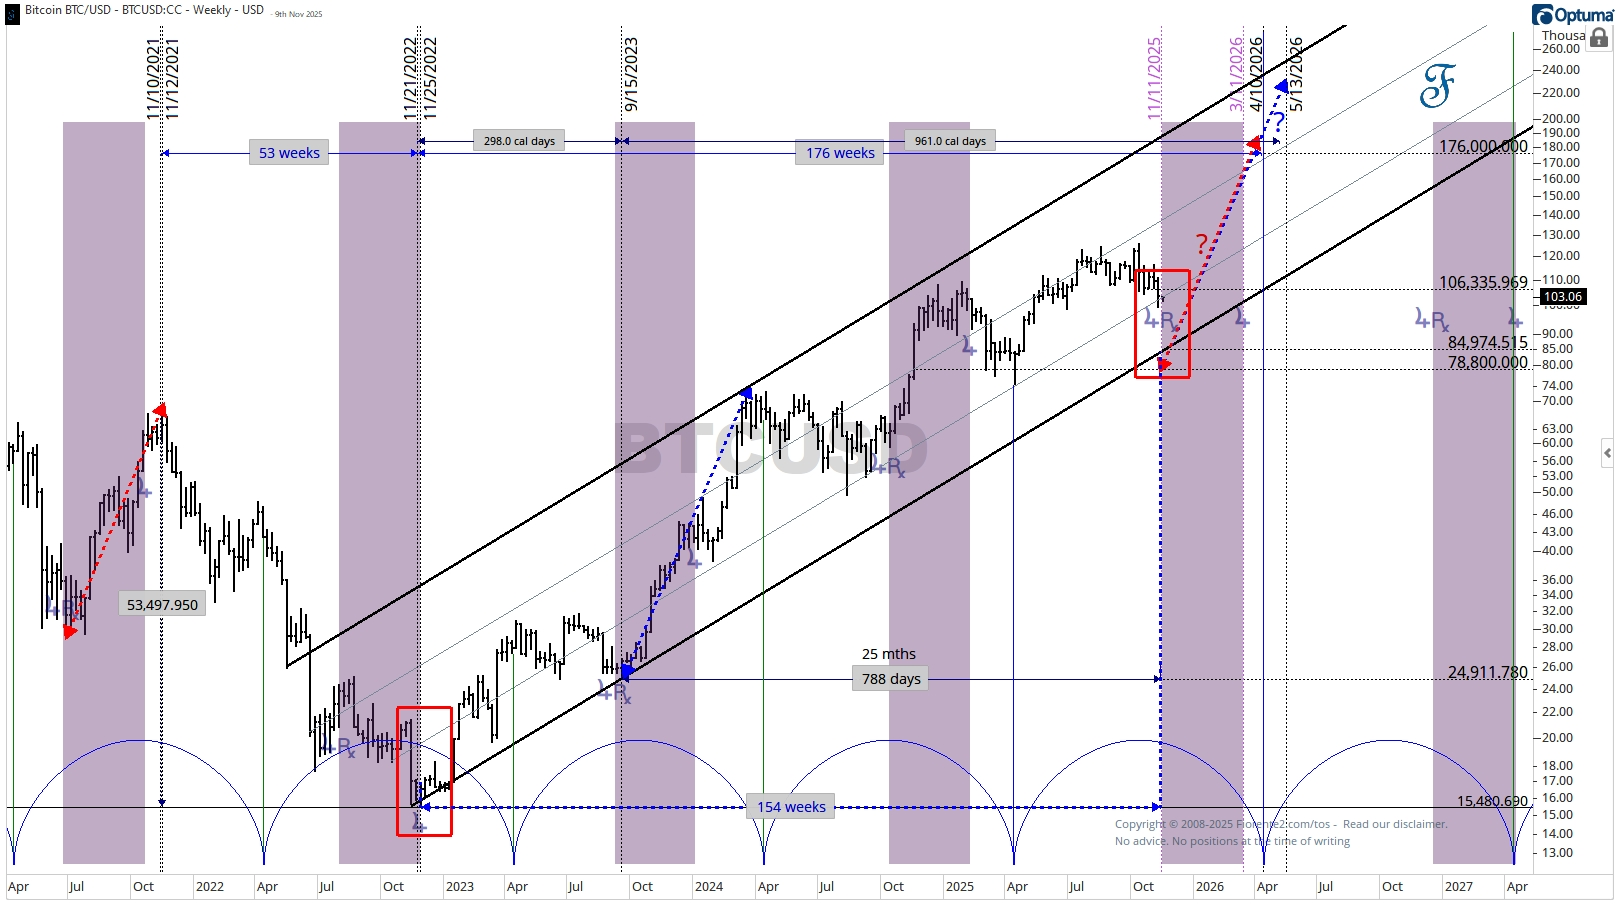
Three years ago, BTCUSD hit its low after 53 weeks of a nearly-perfect $ 1,000-per-week decline from the November 10, 2021, high. It was a perfect time and price alignment (at a rate of $1,000/week).
Squaring the low of November 2022 around $15,400, 154 weeks later, we will be on November 11th, 2025. This is 788 trading days from the second higher low of September 15, 2023. Can BTCUSD decline to $78,800?
As seen in November 2022 (see the red box), when BTCUSD experienced a significant drop in just one week, this could happen again. We might even see an overshoot towards $75,000, which was around the low of April 7, 2025.
During Jupiter Retrograde periods in the past (drawn in purple), huge advances or declines have been noticed, so be careful during this period. So, it may go either way: even a short uptrend just after Jupiter goes Retrograde, followed by a continuation of the decline. (No advice).
Conclusion
This November period is the moment of truth for Bitcoin to see if it still has legs to reach higher highs. Huge advances and declines have been seen during Jupiter Retrograde periods so that it can go either way.
Bitcoin may even go sideways during the Jupiter Retrograde (Rx) period.
Many times in the past, Bitcoin has changed trend around mid- to late November. Hence, I do not rule out a final drop into the lower trend channel line around the time that Jupiter goes Retrograde (November 11, 2025), or within 2-3 weeks of that time.
However, any continuation of a decline in Bitcoin (BTCUSD) below the lower trend line (black) is most likely bearish.
This is my bias for now. Remember, cycles can contract, extend, and invert.
In case you haven’t noticed, I recently posted various charts in the Substack notes. You can find them all here. (click on the link)
P.S.: Occasionally, I share new analyses exclusively for free subscribers. Subscribing gives you email updates on these posts, plus extra insights and deeper research from the time you join onward; past analyses are not included.
If you liked this post from @Fiorente2’s Blog, why not restack and share it?
© 2008–2025 Fiorente2.com. All Rights Reserved.
Disclaimer: This analysis is for informational and educational purposes only and should not be considered investment advice. Read our full disclaimer.
Disclosure: From time to time, I may hold positions in the securities mentioned.